Instructions
A program for tracing the routes of information packets is included in almost every network operating system. On Windows it is tracert, and on GNU / Linux and Mac OS it is traceroute. The principle of operation of this program is as follows: The program sends packets of information to the specified address, setting deliberately impracticable delivery conditions - a very short packet lifetime (TTL - Time To Live). When sending the first packet, it is equal to 1 second. Every server on the way from your computer to the correct address must decrease this value by at least one. Therefore, the packet's lifetime will expire on the first node, and the latter will not transmit it further, but will send a notification to the sender about the impossibility of delivery. In this way, the tracer will obtain information about the first intermediate node. Then it will increase the packet lifetime by one and retry sending. This request will live up to the second node and the situation. Thus, the tracing program will compile a list of all intermediate nodes, and if it does not receive a notification from any one, this will mean one of two things - either the packet is still delivered to the recipient, or this node does not execute. To find out, it will send a request with another defect - a deliberately non-existent port number will be indicated. If this packet returns with an error indication, then the node is working normally and it is the recipient, and if not, then the packet delivery chain is broken at this node. In any case, the tracing procedure will be completed at this point.
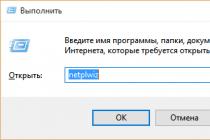
On Windows, the executable file of this program (tracert.exe) is stored in the WINDOWSsystem32 folder on system disk your computer. But to run the program there is no need to search for the file. This program is only controlled from command line so you need to start the command line terminal first. To do this, in the main menu (on the "Start" button) select the "Run" item to open the "Run Program" dialog box. You can also open it by pressing the WIN + R key combination. Then type "cmd" (without quotes) and press the "OK" button (or press Enter). In the terminal that opens, type tracert and, separated by a space, the address of the node on the network to which you want to trace. This can be either an IP address or a domain name. You do not need to specify the http protocol. After the tracing is finished, the result can be copied - press CTRL + A to select everything and Enter to copy the selection to RAM... Then you can paste the copied into any document of any text editor.
A trace operation writes specific SQL statements to the operating system file, as well as the corresponding information (query plans and event waits) that is executed while the script is running. You can trace any arbitrary session in the Oracle database.
Instructions
Before, you need to enable statistics collection, otherwise files with zero times will appear. To do this, you need: alter system set timed_statistics = true If you need to start tracing in the current session, then the system parameter should be replaced with session.
Make sure the attribute maximum size the dump file is significant enough. To do this, execute the appropriate SQL query: SELECT value FROM v $ param p WHERE name = 'max_dump_file_size' The value of $ param can be set both at the database level (alter system) and at the session level (alter session).
To start tracing, you must set event 1046 in the corresponding session. Run the procedure sys.dbms_system.set_ev, and then pass the obtained sid and serial values as integer parameters: BEGIN sys.dbms_system.set_ev (sid, serial #, 10046, 8, ‘’); END
To turn off tracing, change the value of the event level 10046 from 8 to 0.
The trace file appears in the Oracle database dump directory (Oracle / admin / databaseSID / udump). The name of this file contains the identifier of the OS process in which the operation was performed, and the extension is .trc. In order to process the information in a readable form, process the trace file in the tkprof utility: cd C: ORACLEadmindatabaseSIDudump
tkprof file.trc output = my_file.prf The processed file will list all the commands that were executed during the session.
The minimum level for executing the command 10046 is 1, and the maximum is 12, at which the values of all variables associated with the process are added, as well as information about expectations.
Sites on the network do not arise by themselves - they are created and maintained by computers called servers, and these servers are managed by an organization - a provider or a hosting provider. And so that everything is clearly and accurately reproduced for everyone, the provider monitors its network equipment, servers, communication channels through which information and other various data are transmitted directly to users. In turn, the user can diagnose his Internet connection in the event that he cannot receive this information in order to determine whether the hosting or the provider through which the Internet access is provided is to blame. Tracing the route from the personal computer to the required site helps in such diagnostics.

Instructions
Trace using the traceroute command in Windows-tracert. In order to trace the route, do the following: open the menu "Start" - "Run". Enter cmd.exe and select OK.
In the command line, type the tracert server_name command (the server name is indicated in the welcome email when ordering the service). Wait for the command to complete, then right-click in the Command Prompt window, select Select All, then (after highlighting) press Enter. Further, in order to see the trace, right-click, then click "Paste" in the message input field.
With the tracert command, you send data packets to the address you specified - this can be the server address, the name of the computer on the network, or the IP address. In this case, the packets go through special routers - network devices between personal computer and the addressee. With this action, you determine the route to the final destination and, most importantly, calculate the response time (in milliseconds) of each intermediate node.
In those sections where the response time is the shortest, the transmission is performed as quickly as possible - this means that the channel is free and information is delivered without any interference. In the place where the response time is the maximum of some standardized value, we see the consequence "Exceeded the waiting interval for the request", which is equivalent to the loss of information packets.
In this way, you can calculate at which particular connection point the problem exists. If the data does not reach the addressee, then the problem is in him. If the connection drops in the middle, the problem is with one of the intermediate network devices. At the same time, from another PC or via another route (if any), your site that has not opened may be quite accessible. If the information does not leave the boundaries of your provider's network, then the problem is in it.
Related Videos
Routing completes the design of the electronic equipment and defines the lines that connect the components that make up the designed device. It includes certain steps for executing the program and stopping at commands, lines. Tracing tasks are laborious due to the variety of methods for technological implementation of connections.

Instructions
Use special program for a trace that you probably already have in your network operating system... If it is Windows, the program is called tracert; on GNU / Linux and Mac OS operating systems, tracing can be done using traceroute. In this case, the packet information is sent to the address assigned to it. Specifically set impracticable delivery parameters, for example, the packet lifetime is too short. For the first packet, it is better to set it to one second.
Make sure that each server located on a segment from your computer to the specified address must decrease this value by one. Thus, the packet lifetime expires immediately on the first node of the route, which will then automatically send a notification about the impossibility of delivering a packet containing data. Due to this circumstance, the tracing program will have access to information about the first intermediate node.
Increase the life of the information package by one and try again. Now the second smart host will not be able to send it further and will be forced to send an NDR. Repeat these steps, increasing the life of the package by one each time. Using these actions, the tracing program will compile a list of all nodes contained in the interval from the computer to the final address.
Check the correct functioning of all intermediate points... If the program does not receive notification from one of the points, it will send a request with the following defect: the port number does not exist. When the package returns with an error it will mean normal work node. In the event that this does not happen, there is a break at the node. End the tracing program.
Related Videos
converting a raster (pixel) image to a vector (where the image is described using mathematical formulas).
Tracing can be carried out both automatically and in manual mode... Some vector graphic editor have built-in automatic tracing functions, but the result is a file with a lot of reference points which is difficult to use. However, if you have a bitmap file that needs to be printed to large size(for example, stretch a regular photo for a poster on the wall of a building), then autorouting and then zooming in will be the only solution. Manual tracing is the tracing of the contours of the desired image using the tools available in the program for creating Bezier curves.
Tracing in programming
The step-by-step execution of the program with the receipt of changes in all parameters or stopping at each operation is also traced. It is useful if you are debugging your own code. Sometimes the algorithm is correct, but for some reason it doesn't work. It is tracing that allows you to understand at what stage the error occurs. Also, the tracing method helps to understand someone else's code.
Ray tracing
Ray tracing, or path tracing, is a rendering method (creating an image from a 3D model) in computer graphics, which belongs to geometric optics. It allows you to build an image based on knowledge of the laws of how individual rays of light interact with existing surfaces. In ray tracing, the program's algorithm sends rays from the "camera", and they are reflected from different surfaces until they are absorbed or scattered. The more rays have been traced, the better the result will be.
This rendering method allows you to build images of the best quality, but requires powerful computational resources. However, some effects are simply impossible to recreate with other rendering methods, so sometimes ray tracing is the only thing. possible solution.
Tracing as building links
Trace also means finding lines that will connect the nodal points of a system. If you are designing a computer board (for example, a video card), then routing in this process is finding the lines that will connect the pins of the board elements.
"Aaa, help me, it's all gone!" - if your inner voice reacts to a disconnection with the server something like this, this material is definitely for you. :) Of course, for our part, we do our best every day so that nothing interferes with your work in, but if force majeure happens, we will figure it out. And in order to quickly navigate the situation and understand which side of the error is on, here's a minimum task for you - during a break, first of all, perform a route trace and ping intermediate nodes. How to do all this, now we will tell you.
Route tracing
During tracing, data packets are sent between the local computer and the server. This helps to trace the path of the request to the server and determine at what stage the break occurs. Tracing is fairly easy.
1. Run the cmd command: Win + R> write down cmd> ok.
tracert H.H.H.H(where X.H.H.X is the server's IP address or domain) and click Enter.
In the example, we made a trace for google.com.
tracert google.com
It turned out like this:
1 2 1 ms 1 ms 1 ms 193.151.89.254
3 5 ms 4 5 1 ms 6 1 ms 7 1 ms 3 ms 1 ms bearline-ic-324086-ffm-b4.c.telia.net
8 1 ms 1 ms 1 ms 108.170.251.129
9 13 ms 13 ms 15 ms 66.249.94.135
10 13 ms 13 ms 13 ms fra15s12-in-f46.1e100.net
As you can see, our packets overcame ten (there may be fewer or more) nodes, and overcame them successfully. Otherwise, if the packets "stumbled" on one of the nodes, on it (and subsequent nodes after it) we would see:
* * * Timed out request.
But even in this case, it is not yet time for conclusions - this entry can mean both packet loss and the fact that the host is simply closed with security settings. Sometimes providers specifically configure nodes so that they do not respond to trace packets in order to reduce the load. To find out exactly whether a break is really happening, and if so, where exactly, you need to ping each of the nodes. When tracing, we got the IP of each of them, which means we can move on to ping.
Ping intermediate nodes
Ping is designed to check the integrity and quality of connections. It is also easy to execute. In this case, you need to launch a ping to all intermediate nodes in separate windows. So immediately at the moment of a connection break, it will be seen at which node the packet loss occurs and how long these breaks are.
In Windows, only four packages are transferred by default, which is not enough if the problem occurs for a short time. Therefore, you need to remove this limitation by the parameter -t(to then stop the exchange of packages, press CTRL + C).
Now in order.
1. Run the cmd command: Win + R> write down cmd> ok.
2. In the command line that opens, enter ping -t H.H.H.X(where X.H.H.X is the address of one of the intermediate nodes that we learned from the trace) and press Enter.
In our case, when tracing, we identified ten nodes, which means that the ping must be performed ten times in ten separate windows.
Healthy!
If you need to constantly monitor the quality of the connection, for Windows you can use the convenient PingPlotter program.
So, let's ping - in ten separate command line windows, enter commands with the IP addresses of the nodes that we identified during the trace. In our case, there will be such commands:
ping -t 10.1.1.1
ping -t 193.151.89.254
ping -t 85.195.75.129
ping -t 213.248.79.29
ping -t 62.115.139.50
ping -t 62.115.120.8
ping -t 62.115.153.215
ping -t 108.170.251.129
ping -t 66.249.94.135
ping -t 216.58.208.46
If in any of the windows you see "Waiting interval exceeded" from the very first seconds, do not rush to shout: "Gotcha!" If the following nodes ping normally, then this one is simply closed by the settings. In our case, for example, the penultimate node (66.249.94.135) immediately says that the interval has been exceeded, but there are no problems with pinging the tenth node.
Whose side is the mistake?
So, the cliff was repeated. But this time, running a ping of intermediate nodes will help "expose" the culprit. Everything is simple here - from which node you started to receive "Waiting interval exceeded", that is the weak link.
Who is to blame is clear, now you need to understand what to do in specific situations.
1. The last node. If the last node pinged normally at first (some Windows machines do not respond to pings at all, this is set in the firewall settings) ...
... and after the break it started showing "Waiting interval exceeded", the break occurs on your server.

In this case, go to the control panel, start the console and enter the operating system to find out why the server is not working. If it turns out that the operating system is frozen, restart the server.
2. Any nodes except the last one. In this case, contact the technical support of both the cloud and the Internet provider at the same time. At the same time, be sure to indicate how the tracing of the route initially looked, and make a list of nodes indicating which of them the ping was interrupted during the break, and which did not. Be careful, this important information, make no mistake.
3. All nodes at the same time. If all the ping windows started showing "Timeout exceeded", the problem is with your computer or the network to which it is connected.
Bonus!
Well, to make you feel completely comfortable, we have selected utilities with which you can trace and ping intermediate nodes in one simple movement without launching fifteen different windows.
For Windows operating systems, such optimization is performed by the utility Winmtr... It does not need installation and is ready to use immediately after unpacking from the archive.
In field Host specify the destination server with which the connection will be checked and click Start:

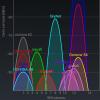
In our example, the route trace and all intermediate nodes are visible. At the same time, ICMP packets are sent to each of them, which can be used to determine the quality of the connection.
Actually, this is the main advantage of the utility - its output is constantly updated, this allows you to collect statistics, track averages, trends and any changes in the quality of the network.
Since we are checking the connection to the server, we are interested in the columns Sent(packages sent) and Recv(packages received). If the values in these columns do not match, then the quality of communication with the site has deteriorated. What to do? Contact the appropriate technical support.
The Loss column will help you view the dynamics of losses as a percentage.
The utility also allows you to copy text in convenient formats ( .txt and .html) to the clipboard ( Copy to clipboard) or into a separate file ( Export).
Double-clicking on an intermediate node will provide additional information about it.
It's important to know!
To detail the problem, technical support specialists may request additional pings with special settings. To do this, it is enough to enter them in the window. Options which will allow you to specify:
- Interval (sec)- data update time in seconds.
- Max host in LRU list – maximum amount hosts (or IP addresses, if the option is not active Resolve names) to the end point.
- Ping size (bytes) - ICMP packet size.
- Resolve names- the ability to convert an IP address to a hostname.
And what about Linuxoids?
For Linux operating systems, the utility is simply called MTR. If it is not in your operating system, you can install it in one of the following ways:
Debian / Ubuntu / Mint:
$ apt-get install mtr
CentOS / RedHat / Fedora:
$ yum install mtr
MTR has the same functionality as Winmtr and also has a similar graphical interface. You can run the utility with the command:
where X.X.X.X is the destination server IP or hostname.

In this case, the following columns are of interest:
- Loss% - The percentage of lost packets between the sending computer and intermediate nodes.
- SNT is the total number of packets sent.
As soon as something is lost somewhere, the utility signals this to us by painting the node red and calculating the percentage of losses.
Separately, we note the ability to run the utility in text (console) mode. To do this, just add the -t or --curses option:
mtr --curses site

Consider a few more important options MTR, which can be extremely useful in the process of network diagnostics.
R or --report
Runs report mode in which the MTR will process the specified number of cycles (defined by the -c option), then display statistics and exit automatically. This mode is useful for collecting network quality statistics.
C COUNT or --report-cycles COUNT
Allows you to set the number of cycles after which the MTR exits.
P BYTES or --psize BYTES
Sets the size of packets in bytes.
I SECONDS or --interval SECONDS
Specifies the interval between packets sent.
N or --no-dns
Allows not to use DNS, displays the IP addresses of the hosts.
A X.X.X.X or --address X.X.X.X
Allows you to specify the address of the computer interface from which ICMP requests will be sent.
Total
Of course, the commands in the console give a more accurate result, since even single packet losses (short drops) are recorded, but Winmtr and MTR are compact and more convenient to use. And on what to opt for, it's up to you. :)
Here, in fact, everyone who is to blame - found out what to do - too. :) We hope the material was useful to you, and if you still have additional near-cloud questions, please contact us for a competent one.
Tags:,Instructions
Start checking the trace on Windows. Start command processor cmd. To do this, click on the "Start" button located in the taskbar on the desktop, or press the Win button on the keyboard. From the displayed menu, select Run. Enter cmd in the "Run Program" dialog that appears. Click OK.
Examine the command line options for the tracert utility. In the shell window, type: tracert /? And press Enter. Check the displayed information.
Check the tracing on Windows using the tracert utility. In the console, enter a command like: tracert<имя цели>and press Enter. Wait for the output of the trace result. Here, as a parameter<имя цели>the target machine's IP address or the corresponding symbolic name (domain) resolved to IP using DNS must be specified. If necessary, use a trace with arbitrary parameters... For example, use the -d option to speed up the process. In this case, the definition of the symbolic names of intermediate nodes by their IP addresses will not occur. Use the -h parameter to increase the maximum possible number of hops if the target was not reached in 30 hops (the default value of this parameter). If there are a lot of errors on intermediate nodes, increase the waiting time for a response using the -w switch.
Begin the process of checking the trace on Linux-like systems. Go through the login process with your credentials. If necessary, start the graphical shell and wait until it finishes loading. You can also continue working in the text console. If a graphical shell was loaded, start a terminal emulator (konsole, xterm, etc.).
Get built-in help for the traceroute utility. In the console, enter the command: traceroute --help and press Enter. Review the displayed information.
Get help on running traceroute using the appropriate man documentation package, if installed. Enter the command: man traceroute and press Enter. Read the information. Press q to exit reading mode.
Check the trace using the traceroute utility on Linux-like systems. To trace with the default parameters, enter the following command in the console: traceroute<имя цели>and press Enter. Wait for the process to complete. The purpose of the parameter<имя цели>similar to what was described in the third step. Use the appropriate command line parameters to change the behavior of traceroute.
Quite recently, for some reason, my blog was not displayed on the computer that was located at work, although my blog was displayed on the computer at home (yes, it is a sin - there are times when, instead of my direct responsibilities at work, I am engaged in my website) ...
Google Browser Chrome outputted:
"Error 101 (net :: ERR_CONNECTION_RESET): Connection dropped."
It’s a pity that I didn’t think to take a screenshot of the error right away, but it looked something like this:

I turned to those. support to your hosting provider, describing your problem in great detail.
The hosting consultant asked me to tell him my IP address, ping and trace to the server.

Do you think I immediately figured out where to look for these parameters? Heh, not immediately, but not at a loss and managed to answer the consultant. Well, as you already understood, I am writing this material in hot pursuit and from personal experience. What if someone comes in handy?
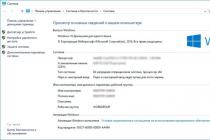
How do I find my IP address?
How do I ping?
First, let's find out what ping is.
ping- this is the period of time during which a data packet sent from your computer reaches the server and returns back.
So how do you ping and send the result to your hosting provider?

Or you can use the most fast way: call the "Run" command with the keyboard shortcut "Win + R":
2). A window will appear where you need to write the command "cmd" in an empty field and click on the "OK" button:

3). A black window will open, in which you need to register the command "ping site address" (in my case it looked like this: "ping site") and press the "Enter" key:


5). To copy the result for sending to the hosting provider, you need:


To insert the resulting result into Text Document or in correspondence with those hosting support, you just need to press "CTRL + V".
Like this in a simple way you can ping.
How do I trace (tracert) the server?
First, let's find out what a server tracert is.
Server tracert - it is a network service designed to get a list of Internet nodes through which data packets pass to the server of the host you are requesting.
That is, using the tracert command, you can find out the path of the request to the server and identify at which point on the route there are transmission problems.
To trace the server, you need to do the following:
1). In Windows XP / 7. Click on the "Start" button, which is located in the lower left corner of the monitor screen, and go to the "Run" tab:
Alternatively, you can use the fastest way to invoke the Run command by pressing the Win + R key combination:
2). In the window that appears in the empty field, you need to register the command "cmd" and click on the "OK" button:
3). A black window will open, in which you need to register the command "tracert site address" (in my case it looked like this: "tracert site") and press the "Enter" key:

4). After a couple of seconds, the computer will give the result:

5). To copy the result for sending to the hosting provider, you need:
- right-click on the black screen. A pop-up menu will appear, select the "Select All" tab there:

All text in the black box is highlighted in white. To copy all this text, you need to press the "Enter" key.

Traceroute is a network diagnostic tool. With its help, you can find out the route, including intermediate nodes, from your computer to the checked site or ip address.
If there is a problem with accessing the site, tracing will help identify the cause.
How to trace
You need to open the command line, in the operating room Windows system this can be done in several ways.
For Windows XP
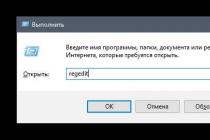
- On the menu Start section Accessories open "Command Prompt", or in the menu Start click on the line Execute where write cmd
and press Enter 
A universal way for Windows 7; Windows 8, and Windows 10
- Press the keyboard shortcut Win + R in the window that opens, write cmd  A black window will open where you need to register the command:
tracert your-domain.ru
and press Enter on keyboard  In order to copy the result, you need to right-click " Mark» (« Highlight" or " Flag"), Select the text and click Enter.

By executing the command tracert data packets are sent to a specific recipient (site or ip). The sent packets go through all intermediate nodes between your computer and the recipient (usually routers from different providers). Thus, with the help of tracing, the route to the site or ip address you need is determined, and the response time of each intermediate node in milliseconds. The shorter the response time, the faster the transmission of packets along this section of the route.
If on some nodes the command returns asterisks *, then there are problems with tracing packets to this host. For a more detailed analysis of the trace route, you can use mtr.