The drawing area can have different sizes. The most common is the A4 size, which is the size of a standard sheet of writing paper (21 cm wide x 29.7 cm high), often half the smaller A5 size (14.8 cm wide x 21 cm high) or twice the size of the A3 size ( 29.7 cm wide and 42 cm high).
You can fill the entire area of the drawing area with the drawing or leave it at the edges of the field. Margins are recommended, as not all printers can print sheets without margins.
The drawing area can be positioned vertically (the width of the sheet is less than the height) - this orientation is called portrait. The drawing area can also be positioned horizontally (the width of the sheet is greater than the height) - this orientation is called landscape.
Technology of drawing graphic primitives. Raster and vector graphics editors allow you to draw graphic primitives (straight line, curved line, rectangle, polygon, circle) in the drawing field.
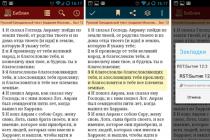
Buttons for drawing graphic primitives are located on toolbar, which is usually placed vertically along the left edge of the graphics editor window (Fig. 1.13). To draw the selected object, click on the button with its image on the toolbar and move the mouse pointer to the drawing field, where it will take the form of a cross. Then, by clicking in the drawing field, you need to fix the positions of the reference points of the object being drawn.
The procedures for drawing graphic primitives in raster and vector editors are almost the same, but the results of drawing differ significantly. In a raster graphical editor, the drawn object ceases to exist as an independent element after drawing is completed and becomes just a group of pixels in the drawing. In the vector editor, this object continues to retain its identity, and you can copy, move, change its size, color and transparency.
 |  |
| Rice. 1.13. Graphic editors: raster Paint and vector OpenOffice Draw |
Line. To draw a line, select a graphic primitive on the toolbar Line, place the mouse pointer in a certain place in the editor window and click to fix the point from which the line should start. Then you need to drag the line in the desired direction and, by clicking again, fix the end of the line.
Before drawing, it is possible to set the line type (solid, dotted, etc.), its thickness and color using additional menus.
Curve. To draw a curve, you must select a graphical primitive Curve, draw an arbitrary line and drag it with the mouse to give it the desired shape.
Rectangle. To draw a rectangle, you must select a graphical primitive Rectangle, click to fix the position of the first vertex, drag the pointer diagonally and fix the position of the second vertex.
Polygon. To draw a polygon, you must select a graphical primitive Polygon, fix the position of the vertices by successive clicks and double-click to fix the position of the last vertex.
Oval and circle. To draw an oval, you must select a graphic primitive Oval (Ellipse), fix the position of the point of the oval with a mouse click, drag the pointer diagonally and fix the position of the point opposite to the center of the oval. If you hold down the (Shift) key while drawing, a circle will be drawn.
Color palette. Distinguish line color, which draws the contours of geometric primitives, and fill color, which paints the inner areas of primitives. The color selection operation can be carried out using the menu Palette A that contains the set of colors used when creating objects.
Expanded palette. Color selection using the menu Palette limited as it contains only a few dozen colors. However, graphic editors allow you to use an extended palette of colors, in which you can choose from a set of tens of millions of colors.
Pipette. In raster graphics editors, you can use the tool to copy colors. Pipette. Clicking on an area with the desired color sets it as the line color or fill color.
If you move the mouse pointer over the button on the toolbar of the graphical editor, a tooltip with the name of the tool will appear.
Control questions
1. What are the main parameters of the drawing area?
2. What graphic primitives and drawing procedures do you know?
3. How can I set the line color and fill color?
Tasks for self-fulfillment
1.10. Practical task. Demonstrate the capabilities of a raster graphics editor by creating an image similar to fig. 1.13.
1.11. Practical task. Demonstrate the capabilities of a vector graphics editor by creating an image similar to fig. 1.13.
1.12. Practical task. In a raster graphics editor, add a color to the extended palette.
1.13. Practical task. In a vector graphics editor, add color to the extended palette.
Option 1
1. One of the main functions of the graphic editor is:
1) image scaling;
2) storage of the image code;
3) creating images;
4) viewing and displaying the contents of the video memory.
2. An elementary object used in a raster graphics editor,
is:
1) dot (pixel);
2) object (rectangle, circle, etc.);
3) color palette;
4) familiarity (symbol
3. Grid of horizontal and vertical columns, which is formed on the screen
pixels is called:
1) video memory;
2) video adapter;
3) raster;
4) display processor;
4. Graphics with the representation of the image as a set of objects
called:
1) fractal;
2) raster;
3) vector;
4) rectilinear.
5. A pixel on a display screen is:
1) the minimum area of the image, which can be independently
set color;
2) binary code of graphic information;
3) electron beam;
4) a set of 16 phosphor grains.
6. Video controller is:
1) display processor;
2) a program that allocates video memory resources;
3) an electronic volatile device for storing information about
graphic image;
4) a device that controls the operation of the graphic display.
7. The color of the dot on the display screen with a 16-color palette is formed from the signals:
1) red, green and blue;
2) red, green, blue and brightness;
3) yellow, green, blue and red;
4) yellow, blue, red and brightness.
8. Which way of presenting graphic information is more economical in terms of
memory usage:
1) raster;
2) vector.
Test on the topic "Coding and processing of graphic information"
Option 2
1. Toolbar buttons, palette, workspace, menus form:
1) a complete set of graphic primitives of the graphic editor;
2) the environment of the graphic editor;
3) list of operating modes of the graphic editor;
4) a set of commands that can be used when working with a graphic
editor.
2. The smallest element of the screen surface for which
address, color and intensity, is:
1) symbol;
2) phosphor grain;
3) pixel;
4) raster.
3. Deformation of the image when changing the size of the picture is one of the disadvantages:
1) vector graphics;
2) raster graphics.
4. Video memory is:
1) an electronic device for storing a binary image code,
displayed on the screen;
2) a program that distributes PC resources during image processing;
3) a device that controls the operation of the graphic display;
4) part of the random access memory.
5. Graphics with the representation of the image in the form of sets of points is called:
1) rectilinear;
2) fractal;
3) vector;
4) raster.
6. What devices are included with the graphics adapter?
1) display processor and video memory;
2) display, display processor and video memory;
3) display processor, RAM, backbone;
4) backbone, display processor and video memory.
7. Primitives in the graphic editor are called:
1) the environment of the graphic editor;
2) the simplest figures drawn with special tools
graphic editor;
3) operations performed on files containing images created
in a graphic editor;
4) modes of operation of the graphic editor.
8. What is the extension of the Paint graphics editor files?
1) .exe
2) doc
3) bmp;
4) com.
Option 1
Option 2
1
V
b
2
A
V
3
V
b
4
V
A
5
A
G
6
G
A
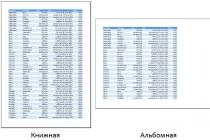
Drawing area. To create a drawing using traditional methods, you must select a canvas (sheet of paper or canvas) of a certain size and orientation. In graphic editors, you can select the parameters of the drawing area (size, margins and orientation), which is called a page, sheet or slide (Fig. 1.12).
Fig Drawing Area Options

The drawing area can have different sizes. The most common is the A4 size, which is the size of a standard sheet of writing paper (21 cm wide x 29.7 cm high), often half the smaller A5 size (14.8 cm wide x 21 cm high) or twice the size of the A3 size ( 29.7 cm wide and 42 cm high).

You can fill the entire area of the drawing area with the drawing or leave it at the edges of the field. Margins are recommended, as not all printers can print sheets without margins. The drawing area can be positioned vertically (the width of the sheet is less than the height) - this orientation is called portrait. The drawing area can also be positioned horizontally (the width of the sheet is greater than the height) - this orientation is called landscape.


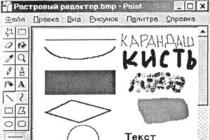
The buttons for drawing graphic primitives are located on the toolbar, which is usually placed vertically along the left edge of the graphic editor window (Fig. 1.13). To draw the selected object, click on the button with its image on the toolbar and move the mouse pointer to the drawing field, where it will take the form of a cross. Then, by clicking in the drawing field, you need to fix the positions of the reference points of the object being drawn.

The procedures for drawing graphic primitives in raster and vector editors are almost the same, but the results of drawing differ significantly. In a raster graphical editor, the drawn object ceases to exist as an independent element after drawing is completed and becomes just a group of pixels in the drawing. In the vector editor, this object continues to retain its identity, and you can copy, move, change its size, color and transparency.

Rice Graphic editors: raster Paint and vector OpenOffice Draw

Line. To draw a line, select the Line graphic primitive on the toolbar, place the mouse pointer in a certain place in the editor window, and click to fix the point from which the line should start. Then you need to drag the line in the desired direction and, by clicking again, fix the end of the line. Before drawing, it is possible to set the line type (solid, dotted, etc.), its thickness and color using additional menus.


Oval and circle. To draw an oval, select the graphic primitive Oval (Ellipse), fix the position of the oval point with a mouse click, drag the pointer diagonally and fix the position of the point opposite to the center of the oval. If you hold down the (Shift) key while drawing, a circle will be drawn.

Color palette. There is a distinction between the color of the lines, which are used to draw the contours of geometric primitives, and the color of the fill, which is used to paint over the internal areas of the primitives. The color selection operation can be performed using the Palette menu, which contains a set of colors used when creating objects.

Expanded palette. Color selection using the Palette menu is limited because it contains only a few dozen colors. However, graphic editors allow you to use an extended palette of colors, in which you can choose from a set of tens of millions of colors.

Pipette. In bitmap graphics editors, you can use the Eyedropper tool to copy colors. Clicking on an area with the desired color sets it as the line color or fill color. If you move the mouse pointer over the button on the toolbar of the graphical editor, a tooltip with the name of the tool will appear.


Tasks for self-fulfillment Practical task. Demonstrate the capabilities of a raster graphics editor by creating an image similar to Fig. Practical task. Demonstrate the capabilities of a vector graphics editor by creating an image similar to Fig. Practical task. In a raster graphics editor, add color to the extended palette Practical task. In a vector graphics editor, add color to the extended palette.

» [To the teacher][Tests][Graphic editor]
GRAPHICS EDITOR
TEST
1. One of the main functions of the graphic editor is:
- image input;
- image code storage;
- creating images;
- viewing and displaying the contents of the video memory.
2. The elementary object used in the raster graphics editor is:
- screen point (pixel);
- rectangle;
- circle;
- Color palette;
- symbol.
3. Deformation of the image when changing the size of the picture is one of the disadvantages:
- vector graphics;
- raster graphics.
4. Primitives in the graphics editor are called:
- the simplest figures drawn with the help of special tools of the graphic editor;
- operations performed on files containing images created in a graphics editor;
- graphics editor environment;
- mode of operation of the graphic editor.
5. Toolbar buttons, palette, workspace, menus form:
- a complete set of graphic primitives of the graphic editor;
- graphics editor environment;
- list of operating modes of the graphic editor;
- a set of commands that can be used when working with a graphical editor.
6. The smallest screen surface element for which an address, color and intensity can be specified is:
- dot;
- phosphor grain;
- pixel
- raster
7. The grid that pixels form on the screen is called:
- video memory;
- video adapter;
- raster;
- display processor.
8. Graphics with the representation of the image in the form of sets of points is called:
- fractal;
- raster;
- vector;
- rectilinear.
9. A pixel on a monitor screen is:
- the minimum area of the image, which can be independently assigned a color;
- binary code of graphic information;
- electron beam;
- a set of 16 phosphor grains.
10. Video adapter is:
- a program that allocates video memory resources;
- an electronic volatile device for storing information about the graphic image;
- monitor processor.
11. Video memory is:
- an electronic device for storing a binary code of the image displayed on the screen;
- a program that distributes PC resources when processing an image;
- a device that controls the operation of the monitor;
- part of the working memory.
12. To store a 256-color image, one pixel is allocated for encoding:
- 2 bytes;
- 4 bytes;
- 256 bits;
- 1 byte.
13. The color of the dot on the screen of a color monitor is formed from the signal:
- red, green, blue and brightness;
- red, green, blue;
- yellow, green, blue and red;
- yellow, blue, red and white;
- yellow, blue, red and brightness.
14. A raster graphic file contains a black and white image (without grayscale) with a size of 100 x 100 pixels. What is the information volume of this file:
- 10000 bits;
- 10000 bytes;
- 10 KB;
- 1000 bits.
15. Bitmap graphic file contains a black and white image with 16 shades of gray, 10 x 10 pixels in size. What is the information volume of this file:
- 100 bits;
- 400 bytes;
- 800 bits;
- 100 bytes?
16. For binary encoding of a color picture (256 colors) with a size of 10 x 10 dots, you need:
- 100 bits;
- 100 bytes;
- 400 bits;
- 800 bytes.
KEY
| 1 | 2 | 3 | 4 | 5 | 6 | 7 | 8 | 9 | 10 | 11 | 12 | 13 | 14 | 15 | 16 |
| 3 | 1 | 2 | 1 | 2 | 3 | 3 | 2 | 1 | 1 | 1 | 4 | 1 | 1 | 2 | 2 |
Lesson duration: 40 min
Lesson topic: “Using a tool (primitive) to create a drawing in the graphic editor PAINT.”
Lesson Objectives:
- Educational - to form a concept about the tools of a graphic editor; continue the formation of the ability to create raster graphic images using the toolbar of the graphic editor.
- Educational – to continue the development of cognitive mental and emotional-volitional processes: attention, memory, imagination.
- Educational - attentiveness, accuracy, interest in the subject;
- developing students' desire for the correct and rational use of computer software capabilities, the use of health-saving technologies as a means of safe computer work;
- developing the skills of working in a pair, a group.
Means of education:
- Hardware (ICT): computer, projector, multimedia screen
- Software: Windows operating system, Microsoft Power Point office program, Paint graphics editor.
- Accompanying presentation.
- Visibility: Rubik's Cube.
During the classes
1. Organizational moment
Greetings. Familiarization with the purpose and objectives of the lesson.
In the previous lessons, we got acquainted with the Paint graphics editor and the elements of its window. Today we will continue to work in a graphic editor using tools called a primitive, we will learn how to create accurate three-dimensional shapes in a graphic editor using a primitive. The result of the lesson will be a drawing of a three-dimensional figure (Rubik's cube).
2. Warm up. Solving logical problems. ( slide 2-4)
But before we start studying the topic, as usual, a small warm-up, which consists in solving logical problems. Such tasks develop attention, logical and imaginative thinking. The answer should be followed by an explanation (why do you think that?)
- There were three glasses of berries on the table. Vova ate one glass of berries. How many glasses are left? (3)
- Three horses ran 5 km. How many kilometers did each horse run? (5)
- What is lighter than a kilogram of cotton wool or a kilogram of iron?
- There were 6 sparrows in the garden. 4 more flew to them, the cat crept up and grabbed one, how many sparrows were left in the garden? (no one)
Well done! They coped with the task.
3. Updating knowledge
Now let's do a little knowledge test on the material covered on the topic “Graphic editor”. (leaves for everyone) On the piece of paper you need to put only one letter (correct answer) for each question. Cross out if answered incorrectly. The rating scale displays the result, what you earned during the knowledge test.
Attention to the screen.
- The minimum object in the graphical editor is:
A. Screen point (pixel);*
b. Color set;
V. An object;
d. Symbol.
The graphic editor is intended for
A. Creating and editing a text document;
b. Creation and editing of reports;
V. Create and edit drawings;*
d. None of the above.
The tools in the graphics editor are:
b. Pencil, brush, eraser;*
d. Color set
- The primitives in the graphics editor are:
a. Line, circle, rectangle;*
b. Pencil, brush, eraser;
V. Select, copy, paste;
g. A set of flowers.
The palette in the graphics editor is:
a. Line, circle, rectangle;
b. Pencil, brush, eraser;
V. Select, copy, paste;
d. Color set*
Now look at your papers and rate (Slide 11)
- 5 - correct answers - “5”
- 4 - correct answers - “4”
- 3- correct answers - “3”
- 2 – 1 correct answers – “2”
4. New theoretical material
And now we move on to the topic of today's lesson. “Using a tool (primitive) when creating a drawing.” (slide 12)
Attention to the screen.
What needs to be done today?
The guys themselves must clearly define 3 points: find out ..., consolidate ... .., get a certain product of knowledge and skills in the end result. (Slide 14-17)
Let's think, what is a computer drawing? Guys thoughts.
All images created using the drawing and drawing tools are called graphics. A computer drawing is schemes, photography, animation, drawing, picture, drawing, i.e. anything created with a computer.
(Slide 18)
What are the advantages of computer drawings? (Conversation with children)
When working in a graphic editor, the pencil never breaks, the eraser is not erased, the paints do not run out. At the same time, clothes and hands remain clean. An unsuccessful drawing on paper will have to be thrown away and started from the beginning. Computer drawing can be corrected until you are satisfied with your work. When the drawing is ready, you can print it and give it to your friends.
Working in a graphic editor, you can feel like a real artist. You will have amazing tools in your hands. ( Slide 19)
Some of the tools have familiar names: Pencil, Eraser, Spray gun. They perform the same actions as real objects. Which? (an eraser - erases, a pencil - draws, a sprayer applies droplets of paint.
(Slide 20-21)
Working in a graphics editor, you will soon see that the pencil is not the best tool for drawing. It is difficult for them to draw straight lines, circles, polygons. Separate tools are provided for their drawing.
Let's think about how best to draw the sun. It is probably more convenient to use for the solar disk Ellipse, and for the rays, the tool is suitable Line.
Many objects around us (for example: a window, a TV set, a book) have a rectangular shape. There is a suitable tool for drawing rectangles − Rectangle.
These tools in the graphical editor are called PRIMITIVE(this is a line, curve, rectangle, ellipse, polygon, rounded rectangle. Please note that I divided the toolbar with a line (this is the primitive). (Slide 22)
It is very difficult to draw a square, a circle, a horizontal and vertical line or a line at an angle to the “eye”, so we use the Shift key to draw (Slide 23)
(Slide 24-27)
How to correct the mistake made in the picture? (Slide 28)
To do this, there is a command in the graphical editor Cancel on the Edit menu, and Eraser
Remember! Need to use command Cancel
- If you have drawn a bad line and you find it difficult to erase it without spoiling other parts of the drawing;
- If you wanted to fill an area, and the paint spilled all over the drawing;
- If you erased with an ERASER and then changed your mind.
The PAINT program can only undo up to the last 4 actions. (Slide 29)
5. A brief safety briefing in the computer class.To ensure safe operation, the following rules must be observed:
- You can not turn on and off the computer without the permission of the teacher.
- Do not touch the screen or the back of the monitor.
- Do not touch the connectors of the connecting cables and wires.
- Do not sit close to the monitor screen.
- Do not get up without the teacher's permission.
- A mouse can become a friend, do not offend a necklace. Train her skillfully, do not twist in your hands idle. ( slide 30-34)
6. Physical education.
It's time to relax and unwind a little.
-Relaxation exercises
. Game "We drop hands" relaxes the muscles of the entire body. Children raise their arms to the sides and lean forward slightly. At the command of the teacher, relieve tension in the back, neck and shoulders. The body, head and arms fall down, the knees are slightly bent. Then the children straighten up, successively unbending in the hip, lumbar and shoulder girdle, and take their original position. The exercise is repeated.
-Exercises to form the correct posture
(“Hand up and hand down”) and breathing exercises:
Up hand and down hand.
Pulled them up a little.
Quickly changed hands!
We are not bored today.
(One straight arm up, the other down, jerk to change hands.)
Clap Squats:
Down - cotton and up - cotton.
Legs, hands stretch,
We know for sure - it will be good.
(Squats, clapping hands overhead.)
We turn our heads,
Stretching the neck. Stop!
(Rotation of the head to the right and left.)
And on the spot we walk
We raise our legs higher.
(Walking in place, raising your knees high.)
Stretched out, stretched out
Up and to the side, forward.
(Sipping - arms up, to the sides, forward.)
Returned to computers -
We have a lesson again.
(Children sit down at computers.)
-
More than a thousand biologically active points are currently known on the ear, therefore, by massaging them, you can indirectly affect the whole body
. You need to try to massage the auricles so that the ears “burn”. The exercise can be performed in the following sequence:
1) sipping on the earlobes from top to bottom;
2) pulling the auricle up;
3) circular movements of the auricle clockwise and counterclockwise.
Well done guys, rested, and now we start working at the computer.
7. Practical work “Drawing a three-dimensional figure”
Probably all of you built palaces and castles from cubes. The cube is a three-dimensional figure. The cube has 6 sides. But how to draw a cube so that it seems voluminous.
There are fairly simple ways to draw three-dimensional figures. Visibility is achieved by draw three visible sides of the cube (front, left and top faces) and shade them with different halftones of the same color.
(Slide 35)
Action algorithm
Children go to computers and start work (on the table, each has an algorithm with a detailed description on the sheets).
8. During work, do eye exercises :
1. Blink quickly, close your eyes and turn gray calmly, slowly counting to 5. Repeat 4-5 times.
3. Stretch your right hand forward. Follow with your eyes, without turning your head for a slow movement of the hand to the left, right, up, down. Repeat 4-5 times.
9. Summing up the lesson.- Evaluation of student work - drawing “Rubik's Cube”
- Questions guys .
Homework.
- Home, repeat, graphics editor tools. Item 2.10 page 97-101.
- An additional task for those students who have a computer at home. Create your own volumetric figure. ( slide 39)
Purpose: To find out the students' perception of the topic of the lesson
Choose the appropriate emoticon and draw it in your notebook.
References and Internet resources:
- Informatics and ICT. Grades 5–7: methodological guide / L.L. Bosova. A.Yu. Bosova. - m.: BINOM. Knowledge Lab, 2009.
- Computer science. Textbook for grade 5. L.L. Bosov
- curriculum archive RusEdu,