Purpose of the report
This report will focus on one of the categories of intelligent technologies that are a convenient analytical tool - OLAP technologies.
Purpose of the report: to reveal and highlight 2 issues: 1) the concept of OLAP and their applied value in financial management; 2) implementation of OLAP functionality in software solutions: differences, opportunities, advantages, disadvantages.
I want to note right away that OLAP is a universal tool that can be used in any applied area, not only in finance (as it can be understood from the title of the report), which requires data analysis by various methods.
Financial management
Financial management is an area where analysis is more important than any other. Any financial and management decision arises as a result of certain analytical procedures. Today, financial management is acquiring an important role for the successful functioning of an enterprise. Despite the fact that financial management is an auxiliary process in the enterprise, it requires special attention, since erroneous financial and management decisions can lead to large losses.
Financial management is aimed at providing the enterprise with financial resources in the required volumes, at the right time and in the right place in order to obtain the maximum effect from their use through optimal distribution.
It is perhaps difficult to determine the level of "maximum efficiency of resource use", but in any case,
The CFO should always know:
- how much financial resources are there?
- where will the funds come from and in what amounts?
- where to invest more efficiently and why?
- and at what points in time do all this need to be done?
- how much is needed to ensure the normal operation of the enterprise?
To get reasonable answers to these questions, you need to have, analyze and know how to analyze a sufficiently large number of performance indicators. In addition, FI covers a huge number of areas: analysis of cash flows (cash flows), analysis of assets and liabilities, analysis of profitability, margin analysis, analysis of profitability, assortment analysis.
Knowledge
Therefore, the key factor in the effectiveness of the financial management process is the availability of knowledge:
- Personal knowledge in the subject area (one might say theoretical and methodological), including experience, intuition of a financier / CFO
- General (corporate) knowledge or systematized information about the facts of financial transactions in the enterprise (i.e. information about the past, present and future state of the enterprise, presented in various indicators and measurements)
If the first lies in the area of action of this financier (or the HR director who hired this employee), then the second should be purposefully created at the enterprise by the joint efforts of employees of financial and information services.
What is now
However, now a paradoxical situation is typical at enterprises: there is information, there is a lot of it, too much. But it is in a chaotic state: unstructured, inconsistent, scattered, not always reliable and often erroneous, it is almost impossible to find and obtain it. A lengthy and often useless generation of financial statements is made, which is inconvenient for financial analysis, difficult to understand, since it is created not for internal management, but for presentation to external regulatory authorities.
According to the results of a study conducted by the company Reuters among 1,300 international managers, 38% of those surveyed say they spend a lot of time trying to find the information they need. It turns out that a highly qualified specialist spends his highly paid time not on data analysis, but on collecting, searching and organizing the information necessary for this analysis. At the same time, managers experience a heavy load of data that is often irrelevant, which again reduces their efficiency. The reason for this situation: an excess of information and a lack of knowledge.
What to do
Information should be transformed into knowledge. For modern business, valuable information, its systematic acquisition, synthesis, exchange, use is a kind of currency, but in order to receive it, it is necessary to manage information, like any business process.
The key to information management is delivering the right information in the right way to stakeholders within the organization at a specific time. The goal of such governance is to help people work better together using increasing amounts of information.
Information technologies in this case act as a means by which it would be possible to systematize information at the enterprise, provide certain users with access to it and give them tools for converting this information into knowledge.
Basic concepts of OLAP technologies
OLAP-technology (from the English On-Line Analytical Processing) is not the name of a specific product, but of a whole technology of operational analysis of multidimensional data accumulated in the storage. In order to understand the essence of OLAP, it is necessary to consider the traditional process of obtaining information for decision-making.
Traditional decision support system
Here, of course, there can also be many options: complete information chaos or the most typical situation when the enterprise has operational systems, with the help of which the facts of certain operations are recorded and stored in databases. To retrieve data from databases for analytical purposes, a system of queries for certain data samples has been built.
But this way of decision support lacks flexibility and has many disadvantages:
- uses negligible amount of data that can be useful for decision making
- sometimes complex multi-page reports are created, of which 1-2 lines are actually used (the rest is just in case) - information overload
- slow reaction of the process to changes: if a new data representation is needed, then the request must be formally described and coded by the programmer, only then executed. Waiting time: hours, days. Perhaps a solution is needed now, immediately. But after receiving new information, a new question will arise (clarifying)
If query reports are presented in a one-dimensional format, then business problems are usually multidimensional and multifaceted. If you need to get a clear picture of the company's business, then it is necessary to analyze the data in different aspects.
Many companies create excellent relational databases, ideally decomposing mountains of unused information on the shelves, which by itself does not provide a quick or sufficiently competent reaction to market events. YES - relational databases were, are and will be the most suitable technology for storing corporate data. This is not a new database technology, but rather an analysis toolkit that complements existing DBMS functionality and is flexible enough to accommodate and automate the different types of mining inherent in OLAP.
Understanding OLAP
What does OLAP give?
- Advanced tools for accessing data storage
- Dynamic interactive data manipulation (rotation, consolidation or drill down)
- Clear visual display of data
- Fast - real-time analysis
- Multidimensional data presentation - simultaneous analysis of multiple indicators across multiple dimensions
To get an effect from the use of OLAP technologies, you must: 1) understand the essence of the technologies themselves and their capabilities; 2) clearly define what processes need to be analyzed, what indicators they will be characterized and in what dimensions it is advisable to see them, that is, create an analysis model.
The basic concepts used by OLAP technologies are as follows:
Multidimensionality
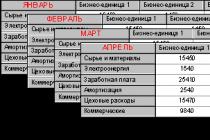
To understand the multidimensionality of the data, you first need to present a table that displays, for example, the performance of Enterprise Costs by economic element and business unit.
This data is presented in two dimensions:
- article
- business unit
This table is not informative, as it shows sales for one any one period of time. For different time periods, analysts will have to compare several tables (for each time period):

The figure shows a third dimension, Time, in addition to the first two. (Article, business unit)
Another way to show multidimensional data is to represent it in the form of a cube:


OLAP cubes allow analysts to get data at different slices to get answers to the questions that the business is asking:
- What are the critical costs in which business units?
- How do business unit costs change over time?
- How do cost items change over time?
Answers to such questions are necessary for making managerial decisions: on reducing certain cost items, influencing their structure, identifying the reasons for cost changes over time, deviations from the plan and eliminating them - optimizing their structure.
In this example, only 3 dimensions are considered. It is difficult to depict more than 3 dimensions, but it works in the same way as with 3 dimensions.
Typically, OLAP applications allow you to obtain data on 3 or more dimensions, for example, you can add one more dimension - Plan-Actual, Cost category: direct, indirect, by orders, by months. Additional dimensions allow you to get more analytic slices and provide answers to questions with multiple conditions.
Hierarchy
OLAP also allows analysts to organize each dimension in a hierarchy of groups and subgroups and totals representing a measure across the entire organization — the most logical way to analyze a business.
For example, it is advisable to group costs hierarchically:
OLAP allows analysts to get data from an overall summary measure (at the topmost level), and then drill down to the bottom and the next level, thus discovering the exact reason for the change in the measure.
By allowing analysts to use multiple dimensions in a data cube, with the possibility of hierarchically built dimensions, OLAP provides a picture of the business that is not compressed by the data warehouse structure.
Change directions of analysis in a cube (data rotation)
As a rule, they operate with concepts: dimensions specified in columns, rows (there may be several of them), the rest form slices, the contents of the table are formed by dimensions (sales, costs, cash)
Typically, OLAP allows you to change the orientation of the dimensions of a cube, thereby presenting data in different views.
The display of cube data depends on:
- dimension orientations: which dimensions are specified in rows, columns, slices;
- groups of indicators highlighted in rows, columns, slices.
- Changing dimensions lies in the user's field of action.

Thus, OLAP allows you to carry out various types of analysis and understand their relationship to their results.
- Deviation analysis - an analysis of the implementation of the plan, which is complemented by a factor analysis of the causes of deviations by detailing indicators.
- Dependency analysis: OLAP allows you to identify various dependencies between various changes, for example, when beer was removed from the assortment during the first two months, a drop in roach sales was found.
- Comparison (comparative analysis). Comparison of the results of changes in the indicator over time, for a given group of products, in different regions, etc.
- Analysis of the dynamics allows us to identify certain trends in the change in indicators over time.
Promptness: we can say that OLAP is based on the laws of psychology: the ability to process information requests in "real time" - at the pace of the process of analytical comprehension of data by the user.
If you can read about 200 records per second from a relational database and write 20, then a good OLAP server, using calculated rows and columns, can consolidate 20,000-30,000 cells (equivalent to one record in a relational database) per second.
Visibility: It should be emphasized that OLAP provides an advanced graphical presentation of data to the end user. The human brain is able to perceive and analyze information that is presented in the form of geometric images, in a volume several orders of magnitude larger than the information presented in alphanumeric form. Example: Suppose you need to find a familiar face in one of a hundred photographs. I believe that this process will take you less than a minute. Now imagine that instead of photographs you will be offered a hundred verbal descriptions of the same persons. I think that you will not be able to solve the proposed problem at all.
Simplicity: The main feature of these technologies is that they are focused on the use not by an information technology specialist, not by an expert statistician, but by a professional in the applied field - the manager of the credit department, the manager of the budget department, and finally the director. They are intended for the analyst to communicate with the problem, not with the computer..
Despite the great capabilities of OLAP (in addition, the idea is relatively old - the 60s), in reality, its use is practically not found in our enterprises. Why?
- there is no information or the possibilities are not clear
- habit of thinking two-dimensionally
- price barrier
- excessive manufacturability of articles devoted to OLAP: unfamiliar terms scare off - OLAP, "digging and slicing data", "ad hoc queries", "identifying significant correlations"
Our approach and Western approach to the application of OLAP
In addition, we also have a specific understanding of the usefulness of OLAP even while understanding its technological capabilities.
Our and Russian authors of various materials on OLAP express the following opinion regarding the usefulness of OLAP: the majority perceives OLAP as a tool that allows you to expand and collapse data simply and conveniently, performing manipulations that come to the analyst's head during the analysis. The more “slices” and “cuts” of data the analyst sees, the more ideas he has, which, in turn, require more and more “slices” to be verified. It is not right.
The Western understanding of the usefulness of OLAP is based on a methodological model of analysis, which must be laid down in the design of OLAP solutions. The analyst should not play with the OLAP cube and aimlessly change its dimensions and levels of detail, data orientation, graphical display of data (and it really takes!), But clearly understand what views he needs, in what sequence and why (of course, elements " discoveries ”there may be, but this is not a fundamental element of the usefulness of OLAP).
Applied use of OLAP
- Budget
- Flow of funds
One of the most fertile fields of application for OLAP technologies. It is not for nothing that no modern budgeting system is considered complete without the presence of OLAP tools for budget analysis in its composition. Most budget reports are easily built on the basis of OLAP systems. At the same time, the reports answer a very wide range of questions: analysis of the structure of expenses and income, comparison of expenses for certain items in different departments, analysis of dynamics and trends in expenses for certain items, analysis of cost and profit.
OLAP will allow you to analyze cash inflows and outflows in the context of business transactions, counterparties, currencies and time in order to optimize their flows.
- Financial and management reporting (with analytics that management needs)
- Marketing
- Balanced Scorecard
- Profitability analysis
When the relevant data is available, you can find a different OLAP technology application.
OLAP products
This section will talk about OLAP as a software solution.
General requirements for OLAP products
There are many ways to implement OLAP applications, then no particular technology should have been required, or even recommended. Under different conditions and circumstances, one approach may be preferable to the other. The implementation technique includes many different proprietary ideas that vendors are so proud of: flavors of client-server architecture, time series analysis, object orientation, storage optimization, parallel processes, and so on. But these technologies cannot be part of the OLAP definition.
There are characteristics that must be observed in all OLAP products (if it is an OLAP product), which are the ideal technology. These are 5 key definitions that characterize OLAP (the so-called FASMI test): Fast Analysis of Shared Multidimensional Information.
- Quick(FAST) - means that the system should be able to provide most responses to users within approximately five seconds. Even if the system warns that the process will take significantly longer, users can become distracted and lose their thoughts, and the quality of the analysis suffers. This speed is not easy to achieve with large amounts of data, especially if special on-the-fly calculations are required. Vendors are resorting to a wide variety of methods to achieve this goal, including specialized forms of data storage, extensive pre-computation, or tightening hardware requirements. However, there are currently no fully optimized solutions. At first glance, it may seem surprising that when receiving a report in a minute, which not so long ago took days, the user quickly becomes bored while waiting, and the project turns out to be much less successful than in the case of an instant response, even at the cost of less detailed analysis.
- Shared means that the system makes it possible to meet all data protection requirements and implement distributed and simultaneous access to data for different levels of users. The system must be able to handle multiple data changes in a timely, secure manner. This is a major weakness in many OLAP products, which tend to assume that all OLAP applications are read-only and provide simplified protections.
- Multidimensional is a key requirement. If you had to define OLAP in one word, you would choose it. The system should provide a multidimensional conceptual view of the data, including full support for hierarchies and multiple hierarchies, as this determines the most logical way to analyze the business. There is no minimum number of dimensions to be processed, as it also depends on the application, and most OLAP products have enough dimensions for the markets they target. Again, we are not specifying what underlying database technology should be used if the user receives a truly multidimensional conceptual representation of the information. This feature is at the heart of OLAP
- Information. The necessary information should be obtained where it is needed, regardless of its volume and storage location. However, a lot depends on the application. The power of various products is measured in terms of how much input they can process, but not how many gigabytes they can store. The power of the products varies greatly - the largest OLAP products can handle at least a thousand times more data than the smallest. There are many factors to consider in this regard, including data duplication, RAM required, disk space utilization, performance, data storage integration, and more.
- Analysis means that the system can handle any logical and statistical analysis specific to a given application, and ensures that it is saved in a form accessible to the end user. The user should be able to define new custom calculations as part of the analysis without the need for programming. That is, all the required analysis functionality must be provided in an intuitive way to end users. Analysis tools could include certain procedures, such as time series analysis, cost allocation, foreign exchange transfers, target search, etc. Such capabilities vary widely among products, depending on the target orientation.
In other words, these 5 key definitions are the goals that OLAP products are designed to achieve.
OLAP technological aspects
OLAP system includes certain components. There are various schemes of their work that a particular product can implement.
Components of OLAP systems (what does an OLAP system consist of?)
Typically, an OLAP system includes the following components:
- Data source
The source from which the data for analysis is taken (data warehouse, database of operational accounting systems, a set of tables, combinations of the above). - OLAP server
Data from the source is transferred or copied to the OLAP server, where it is organized and prepared for faster subsequent generation of responses to queries. - OLAP client
The user interface to the OLAP server, in which the user operates
It should be noted that not all components are required. There are desktop OLAP systems that allow you to analyze data stored directly on the user's computer and do not require an OLAP server.
However, which element is required is the data source: the availability of data is an important issue. If they exist, in any form, like an Excel table, in the database of the accounting system, in the form of structured reports of branches, the IT specialist will be able to integrate with the OLAP system directly or with an intermediate transformation. For this, OLAP systems have special tools. If this data is not available, or it is insufficiently complete and of insufficient quality, OLAP will not help. That is, OLAP is only an add-on over data, and if there is none, it becomes a useless thing.
Most of the data for OLAP applications originates in other systems. However, in some applications (for example, for planning or budgeting), data can be generated directly in OLAP applications. When data comes from other applications, it is usually necessary for the data to be stored in a separate, duplicate form for the OLAP application. Therefore, it is advisable to create data warehouses.
It should be noted that the term OLAP is inextricably linked to the term Data Warehouse. A data warehouse is a domain-specific, time-bound and immutable collection of data to support the management decision-making process. Data in the warehouse comes from operational systems (OLTP systems), which are designed to automate business processes; the warehouse can be replenished from external sources, for example, statistical reports.
Despite the fact that they contain deliberately redundant information, which is already in the databases or files of operating systems, data storages are necessary because:
- data fragmentation, storage in different DBMS formats;
- improved data retrieval performance
- if in the enterprise all data is stored on a central database server (which is extremely rare), the analyst will probably not understand their complex, sometimes confusing structures
- complex analytical queries to operational information slow down the current work of the company, blocking tables for a long time and seizing server resources
- the ability to cleanse and reconcile data
- it is impossible or very difficult to analyze the data of operational systems directly;
The purpose of the repository is to provide the raw materials for analysis in one place and in a simple, understandable structure. That is, the concept of Data Warehouses is not a concept of data analysis, rather it is a concept of preparing data for analysis. It involves the implementation of a single integrated data source.
OLAP Products: Architectures
When using OLAP products, 2 questions are important: how and where keep and to process data. OLAP architectures are distinguished depending on how these two processes are implemented. There are 3 ways to store data for OLAP and 3 ways to process this data. Many manufacturers offer several options, some are trying to prove that their approach is the single most prudent. This is, of course, absurd. However, very few products can operate efficiently in more than one mode.
OLAP data storage options
Storage in this context means the content of data in a constantly updated state.
- Relational databases: This is the typical choice if the enterprise stores credentials in an RDB. In most cases, data should be stored in a denormalized structure (star schema is the most acceptable). A normalized database is unacceptable due to very low query performance when generating aggregated values for OLAP (often the totals are stored in aggregated tables).
- Database files on the client computer (kiosks or data marts): This data can be pre-distributed or generated upon request on client computers.
Multidimensional databases: Assumes that data is stored in a multidimensional database on a server. It can include data extracted and summarized from other systems and relational databases, end-user files, etc. In most cases, multidimensional databases are stored on disk, but some products also allow the use of RAM, calculating the most frequently used data on the fly ". In a very small number of products based on multidimensional databases, multiple data edits are possible, many products allow single edits but multiple reads of data, while others are limited to reading only.
These three storage locations have varying storage capacities and are arranged in decreasing order of capacity. They also have different query performance characteristics: relational databases are much slower than the last two.
OLAP data processing options
There are 3 of the same data processing options:
- Using SQL: this option is, of course, used when storing data in an RDB. However, SQL does not allow for multidimensional computations in a single query, so complex SQL queries are required to achieve nothing more than normal multidimensional functionality. However, that doesn't stop developers from trying. In most cases, they perform a limited number of pertinent SQL calculations, with results that can be obtained from multidimensional data processing or from the client machine. It is also possible to use RAM, which can store data using more than one request: this dramatically improved the response.
- Client-side multidimensional processing: The OLAP client product does the calculations on its own, but this processing is only available if users have relatively powerful PCs.
Server-Side Multidimensional Processing: This is a popular place for multidimensional computing in client-server OLAP applications and is used in many products. Performance is usually good because most of the computation has already been done. However, this requires a lot of disk space.
OLAP architecture matrix
Accordingly, by combining storage / processing options, you can get a matrix of OLAP systems architectures. Accordingly, theoretically, there can be 9 combinations of these methods. However, since 3 of them are devoid of common sense, in reality there are only 6 options for storing and processing OLAP data.
|
Multidimensional storage options Variants |
Relational database |
Server-side multidimensional database |
Client computer |
|
Cartesis magnitude |
|||
|
Multidimensional server processing |
Crystal Holos (ROLAP mode) IBM DB2 OLAP Server CA EUREKA: Strategy Informix MetaCube Speedware Media / MR Microsoft Analysis Services Oracle Express (ROLAP mode) Pilot Analysis Server Applix iTM1 |
Crystal holos Comshare Decision Hyperion Essbase Oracle Express Speedware Media / M Microsoft Analysis Services PowerPlay Enterprise Server Pilot Analysis Server Applix iTM1 |
|
|
Multidimensional processing on the client computer |
Oracle Discoverer Informix MetaCube |
Dimensional Insight Hyperion Enterprise |
Cognos PowerPlay Personal Express iTM1 Perspectives |
Since it is storage that determines processing, it is customary to group by storage options, that is:
- ROLAP products in sectors 1, 2, 3
- Desktop OLAP - in sector 6
MOLAP products - in sectors 4 and 5
HOLAP products (allowing both multidimensional and relational data storage) - in 2 and 4 (in italics)
OLAP product categories
There are more than 40 OLAP providers, although all of them cannot be considered competitors, because their capabilities are very different and, in fact, they work in different market segments. They can be grouped into 4 fundamental categories, which differ based on the concepts: complex functionality - simple functionality, performance - disk space. It is convenient to depict the categories in the form of a square because it clearly shows the relationship between them. A distinctive feature of each of the categories is presented on its side, and the similarities with others - on the adjacent sides, therefore, the categories on opposite sides are fundamentally different.
|
Peculiarities |
Advantages |
disadvantages |
Representatives |
|
|
Applied OLAP |
Complete applications, rich in functionality. Almost all require a multidimensional database, although some work with a relational database too. Many of this category of applications are specialized, for example, sales, manufacturing, banking, budgeting, financial consolidation, sales analysis |
The ability to integrate with various applications High level of functionality High level of flexibility and scalability |
Application complexity (need for user training) High price |
Hyperion Solutions Crystal decisions Information Builders |
|
The product is based on a non-relational data structure that provides multidimensional storage, processing and presentation of data. Data in the analysis process is selected exclusively from a multidimensional structure. Despite the high level of openness, suppliers persuade customers to purchase their own tools. |
High performance (fast summation calculations and various multidimensional transformations for any dimension). The average response time to an ad hoc analytical query when using a multidimensional database is usually 1-2 orders of magnitude less than in the case of an RDB High level of openness: a large number of products with which integration is possible They easily cope with the tasks of including various built-in functions in the information model, conducting specialized analysis by the user, etc. |
The need for a large disk space for storing data (due to the redundancy of the data that is stored). This is an extremely inefficient use of memory - due to denormalization and previously performed aggregation, the amount of data in a multidimensional database corresponds to 2.5-100 times less than the volume of the original detailed data. In any case, MOLAP does not allow working with large databases. The real limit is a base of 10-25 gigabytes Potential database explosion - unexpected, sharp, disproportionate increase in its volume Lack of flexibility when it is necessary to modify data structures. Any change in the structure of dimensions almost always requires a complete restructuring of the hypercube. For multidimensional databases, currently there are no uniform standards for the interface, languages for describing and manipulating data |
Hyperion (Essbase) |
|
|
DOLAP (Desktop OLAP) |
Client OLAP products that are easy enough to implement and have low cost per seat We are talking about such analytical processing, where hypercubes are small, their dimension is small, needs are modest, and for such analytical processing, a personal machine on the desktop is enough. The goal of manufacturers in this market is to automate hundreds and thousands of workplaces, but users must do a fairly simple analysis. Buyers are often directed to buy more jobs than necessary |
Good database integration: multidimensional, relational The ability to make complex purchases, which reduces the cost of implementation projects Ease of use of applications |
Very limited functionality (not comparable in this regard with specialized products) Very limited power (small data volumes, few measurements) |
Cognos (PowerPlay) Business Objects Crystal decisions |
|
This is the smallest sector of the market. Detail data remains where it was originally - in a relational database; some aggregates are stored in the same database in specially created service tables |
Capable of handling very large amounts of data (economical storage) Provides a multi-user mode of operation, including in editing mode, not just reading Higher level of data protection and good opportunities for differentiation of access rights Frequent changes to the measurement structure are possible (do not require physical reorganization of the database) |
Poor performance, significantly inferior in response speed to multidimensional ones (response to complex queries is measured in minutes or even hours rather than seconds). They are more user-friendly report builders than interactive analytical tools Complexity of products. Requires significant IT service costs. Relational systems require careful database schema and index tuning to achieve performance comparable to MOLAP, which means a lot of effort on the part of DBAs. Costly to implement SQL constraints remain a reality, which prevents many built-in functions that are easily provided in systems based on multidimensional data representation from being implemented in an RDBMS. |
Information Advantage Informix (MetaCube) |
It should be noted that consumers of hybrid products that allow ROLAP and MOLAP mode selection, such as Microsoft Analysis Services, OracleExpress, Crystal Holos, IBM DB2 OLAPServer, almost always select MOLAP mode.
Each of the categories presented has its own strengths and weaknesses; there is no single optimal choice. The choice affects 3 important aspects: 1) performance; 2) disk space for data storage; 3) the capabilities, functionality, and especially the scalability of the OLAP solution. At the same time, it is necessary to take into account the volumes of processed data, the power of technology, the needs of users and look for a compromise between speed and redundancy of disk space occupied by the database, simple and multifunctionality.
Classification of Data Stores in accordance with the size of the target database
Disadvantages of OLAP
Like any OLAP technology, it also has its drawbacks: high requirements for hardware, training and knowledge of administrative personnel and end users, high costs for the implementation of the implementation project (both monetary and time, intellectual).
Choosing an OLAP product
Choosing the right OLAP product is difficult, but very important if you want your project to not fail.
As you can see, product differences lie in many areas: functional, architectural, technical. Some products are quite limited in customization. Some are designed for specialized subject areas: marketing, sales, finance. There are products for general purposes, which are not intended for application use, which should be flexible enough. As a rule, such products are cheaper than specialized ones, but there are more implementation costs. The range of OLAP products is very wide - from the simplest tools for building pivot tables and charts that are part of office products, to data analysis and search for patterns, the cost of which is tens of thousands of dollars.
As with any field, there can be no definitive guidelines for the choice of tools in the OLAP realm. You can only focus on a number of key points and match the software capabilities offered to the needs of the organization. One thing is important: if you don't think about how you are going to use OLAP tools, you risk getting yourself a powerful headache.
In the selection process, it is necessary to consider 2 questions:
- assess the needs and capabilities of the enterprise
- assess the existing supply on the market, development trends are also important
Then all this can be compared and, in fact, made a choice.
Needs assessment
You cannot make a rational choice of a product without understanding what it will be used for. Many companies want the “best product” without a clear understanding of how it should be used.
In order for the project to be successfully implemented, the CFO must at least correctly formulate his wishes and requirements to the manager and the automation service specialists. Many problems arise due to insufficient preparedness and information for choosing OLAP, IT specialists and end users experience communication difficulties just because they manipulate different concepts and terms in a conversation and put forward conflicting preferences. You need consistency in purpose within the company.
Several factors have already become apparent after reading the overview of OLAP product categories, namely:
Technical aspects
- Data sources: corporate data warehouse, OLTP system, table files, relational databases. Possibility of linking OLAP tools with all DBMS used in the organization. As practice shows, the integration of dissimilar products into a stable operating system is one of the most important issues, and its solution in some cases can be associated with big problems. It is necessary to understand how easy and reliable it is to integrate OLAP tools with existing DBMS in the organization. It is also important to evaluate the possibilities of integration not only with data sources, but also with other applications into which you may need to export data: e-mail, office applications
- Variability of the data that is taken into account
- Server platform: NT, Unix, AS / 400, Linux - but don't insist that OLAP spec products run on questionable or dying platforms that you are still using
- Client-side and browser standards
- Deployed architecture: LAN and PC modem, high-speed client / server, intranet, extranet, Internet
- International features: multi-currency support, multilingual operations, data sharing, localization, licensing, Windows update
Amounts of input information that are available and which will appear in the future
Members
- Scope of application: analysis of sales / marketing, budgeting / planning, analysis of performance indicators, analysis of accounting reports, qualitative analysis, financial condition, formation of analytical materials (reports)
- The number of users and their location, requirements for the separation of access rights to data and functions, secrecy (confidentiality) of information
- User view: senior management, finance, marketing, HR, sales, manufacturing, etc.
- User experience. User skill level. Consider providing training. It is very important that the OLAP client application is such that users feel confident and can use it effectively.
Key features: need for writeback of data, distributed computing, complex currency conversions, need for printing reports, spreadsheet interface, complexity of application logic, required dimension, types of analysis: statistical, goal search, what-if analysis
Implementation
- Who will implement and operate: external consultants, internal IT or end users
- Budget: software, hardware, services, data transmission. Remember that OLAP product licenses are only a small fraction of the total project cost. Implementation and hardware costs can be greater than license fees, and long-term support, maintenance, and administration costs are almost certainly significantly higher. And if you made the wrong decision to buy the wrong product just because it is cheaper, ultimately you can have a higher total project cost due to higher maintenance, administration and / or hardware costs, while you are likely to receive lower level of business benefits. When estimating total costs, be sure to ask the following questions: How wide is the selection of sources for implementation, training, and support? Is the potential general stock (employees, contractors, consultants) prone to growth or reduction? How widely can you use your industrial professional experience?
Despite the fact that the cost of analytical systems even today remains quite high, and the methodologies and technologies for the implementation of such systems are still at the stage of their formation, even today, the economic effect provided by them significantly exceeds the effect of traditional operational systems.
The effect of the correct organization, strategic and operational planning of business development is difficult to estimate in numbers in advance, but it is obvious that it can exceed the costs of implementing such systems by tens or even hundreds of times. However, one should not be mistaken. The effect is provided not by the system itself, but by the people working with it. Therefore, declarations of the type: "the system of data warehouses and OLAP technologies will help the manager to make the right decisions" are not entirely correct. Modern analytical systems are not artificial intelligence systems and they can neither help nor hinder decision-making. Their goal is to provide the manager with all the information necessary for making a decision in a convenient form in a timely manner. And what information will be requested and what decision will be made on its basis depends only on the specific person using it.
One thing remains to be said, these systems can help solve many business problems and can have far-reaching positive effects. It remains only to wait who is the first to realize the advantages of this approach and will be ahead of the others.
Online analytical processing, or OLAP, is an effective data processing technology, as a result of which summary information is displayed on the basis of huge arrays of all kinds of data. It is a powerful product that helps you access, retrieve and view information on a PC, analyzing it from different perspectives.
OLAP is a tool that provides a strategic position for long-term planning and considers the basic information of operational data in the future 5, 10 or more years. The data is stored in a database with a dimension that is their attribute. Users can view the same dataset with different attributes, depending on the purpose of the analysis.
OLAP history
OLAP is not a new concept and has been in use for decades. In fact, the origins of the technology have been traced back to 1962. But the term was only coined in 1993 by database author Ted Coddom, who also set 12 rules for the product. As with many other applications, the concept has undergone several evolutionary stages.
The history of OLAP technology itself dates back to 1970, when the Express content and the first Olap server were released. They were acquired by Oracle in 1995 and subsequently became the backbone of the online analytical processing of the multidimensional computing engine that the well-known computer brand provided in its database. In 1992, another well-known online analytical processing product, Essbase, was released by Arbor Software (acquired by Oracle in 2007).
In 1998, Microsoft released MS Analysis Services online data processing server. This contributed to the popularity of the technology and prompted the development of other products. Today there are several world renowned suppliers offering Olap applications, including IBM, SAS, SAP, Essbase, Microsoft, Oracle, IcCube.
Online analytical processing
OLAP is a tool that allows you to make decisions about scheduled events. Atypical Olap calculation can be more complex than simple data aggregation. Analytical Queries Per Minute (AQM) is used as a standard benchmark for comparing the performance of different instruments. These systems should hide users from the syntax of complex queries as much as possible and provide consistent response times for everyone (no matter how complex they are).
There are the following main characteristics of OLAP:
- Multidimensional data representations.
- Support for complex calculations.
- Temporary reconnaissance.
The multidimensional view provides the foundation for analytic processing through flexible access to corporate data. It allows users to analyze data in any dimension and at any level of aggregation.
Support for complex calculations is the backbone of OLAP software.
Time intelligence is used to assess the performance of any analytical application over a period of time. For example, this month versus last month, this month versus the same month last year.
Multidimensional data structure
One of the main characteristics of online analytical processing is the multidimensional data structure. A cube can have multiple dimensions. With this model, the entire OLAP mining process is easy for managers and executives, since the objects represented in the cells are real-world business objects. In addition, this data model allows users to handle not only structured arrays, but also unstructured and semi-structured ones. All this makes them especially popular for data analysis and BI applications.

The main characteristics of OLAP systems:
- Use multidimensional data analysis methods.
- Provides advanced database support.
- Create easy-to-use end-user interfaces.
- Supports client / server architecture.
One of the main components of OLAP concepts is the client-side server. In addition to aggregating and preprocessing data from a relational database, it provides advanced calculation and recording options, additional functionality, basic advanced query capabilities, and more.
Different data models and tools are available, depending on the sample application of your choice, including real-time alerts, what-if scripting, optimization, and complex OLAP reports.
Cubic shape
The concept is based on a cubic shape. The location of the data in it shows how OLAP adheres to the principle of multidimensional analysis, as a result of which a data structure is created that is designed for fast and efficient analysis.
An OLAP cube is also referred to as a "hypercube". It is described as consisting of numerical facts (measures) classified by facets (dimensions). Dimensions refer to attributes that define a business problem. Simply put, a dimension is a label that describes a measure. For example, in sales reports, the measure would be the sales volume, and the dimensions would include the sales period, salesperson, product or service, and sales region. In the reporting of manufacturing operations, the measure can be total production costs and units of output. The dimensions will be the date or time of production, the stage of production or phase, even the workers involved in the production process.

The OLAP data cube is the cornerstone of the system. The data in the cube is organized using either a star or a snowflake schema. In the center there is a fact table containing aggregates (measures). It is linked to a number of dimension tables containing measure information. Dimensions describe how these measures can be analyzed. If a cube contains more than three dimensions, it is often referred to as a hypercube.
One of the main functions of a cube is its static nature, which means that the cube cannot be changed after it has been designed. Therefore, the process of assembling the cube and setting up the data model is a critical step towards appropriate data processing in the OLAP architecture.
Combining data
The use of aggregations is the main reason why queries are processed much faster in OLAP tools (compared to OLTP). Aggregations are summaries of data that have been pre-calculated during processing. All members stored in OLAP dimension tables define the queries that the cube can receive.
In a cube, accumulations of information are stored in cells, the coordinates of which are set by specific dimensions. The number of aggregates that a cube can contain depends on all possible combinations of dimension members. Therefore, a typical cube in an application can contain an extremely large number of aggregates. Only key aggregates that are distributed across the entire analytic cube of online analytics will be pre-calculated. This will drastically reduce the time it takes to define any aggregations when executing a query on the data model.
There are also two aggregation-related options that can improve the performance of the finished cube: create a capability cache aggregation, and use aggregation based on the analysis of user queries.
Principle of operation
Typically, analysis of operational information obtained from transactions can be performed using a simple spreadsheet (data values are represented in rows and columns). This is a good thing given the two-dimensional nature of the data. In the case of OLAP, there are differences due to the multidimensional data set. Because they are often obtained from different sources, the spreadsheet may not always handle them efficiently.
The cube solves this problem and also keeps the OLAP data warehouse running in a logical and orderly way. Businesses collect data from multiple sources and are presented in a variety of formats such as text files, multimedia files, Excel spreadsheets, Access databases, and even OLTP databases.

All data is collected in a repository filled directly from sources. In it, the raw information obtained from OLTP and other sources will be cleaned of any erroneous, incomplete and inconsistent transactions.
After cleaning and transformation, the information will be stored in a relational database. It will then be uploaded to a multidimensional OLAP server (or Olap cube) for analysis. End users responsible for business applications, data mining and other business operations will have access to the information they need from the Olap cube.
Benefits of the array model
OLAP is a tool that delivers fast query performance through optimized storage, multidimensional indexing and caching, which are significant system benefits. In addition, the benefits are:
- Smaller data size on disk.
- Automated computation of higher data level aggregates.
- Array models provide natural indexing.
- Efficient data extraction is achieved through pre-structuring.
- Compactness for low-dimensional datasets.
The disadvantages of OLAP include the fact that some decisions (processing step) can be quite lengthy, especially with large amounts of information. This is usually corrected by performing only incremental processing (examining the data that has changed).
Basic analytical operations
Convolution(roll-up / drill-up) is also known as “consolidation”. Convolution involves collecting all data that can be retrieved and calculating all in one or more dimensions. More often than not, this may require the application of a mathematical formula. As an OLAP example, consider a retail network with outlets in different cities. To identify patterns and anticipate future sales trends, data about them from all points is "rolled" into the main sales department of the company for consolidation and calculation.
Disclosure(drill-down). This is the opposite of curdling. The process starts with a large dataset and then breaks down into smaller chunks, thereby allowing users to view the details. In the retail example, the analyst will analyze the sales data and look at the individual brands or products that are considered best sellers in each of the outlets in different cities.

Cross section(Slice and dice). This is a process where analytical operations involve two steps: take a specific set of data from an OLAP cube (the "cutting" aspect of the analysis) and view it from different points of view or angles. This can happen when all point of sale data is received and entered into the hypercube. The analyst cuts a set of sales data from the OLAP Cube. It will then be reviewed when analyzing the sales of individual units in each region. During this time, other users can focus on evaluating the cost-effectiveness of sales or evaluating the effectiveness of a marketing and advertising campaign.
Turn(Pivot). It rotates the data axes to replace the presentation of information.
Varieties of databases
Basically, this is a typical OLAP cube that implements analytical processing of multidimensional data using OLAP Cube or any data cube so that the analytical process can add dimensions as needed. Any information loaded into a multidimensional database will be stored or archived and can be recalled when required.
| Meaning |
|
| Relational OLAP (ROLAP) | ROLAP is an advanced DBMS along with multidimensional data mapping to perform standard relational operation |
| Multidimensional OLAP (MOLAP) | MOLAP - implements work in multidimensional data |
| Hybrid Online Analytical Processing (HOLAP) | In the HOLAP approach, aggregated totals are stored in a multidimensional database and detailed information is stored in a relational database. This ensures both the efficiency of the ROLAP model and the performance of the MOLAP model. |
| OLAP Desktop (DOLAP) | In Desktop OLAP, a user downloads a piece of data from a database locally or to their desktop and analyzes it. DOLAP is relatively cheaper to deploy as it offers very little functionality compared to other OLAP systems |
| Web OLAP (WOLAP) | Web OLAP is an OLAP system accessible through a web browser. WOLAP is a three-tier architecture. It has three components: client, middleware and database server |
| Mobile OLAP | Mobile OLAP helps users get and analyze OLAP data using their mobile devices |
| Spatial OLAP | SOLAP is created to facilitate the management of both spatial and nonspatial data in a geographic information system (GIS) |
There are lesser known OLAP systems or technologies, but these are the main ones that are currently used by large corporations, businesses and even government.

OLAP tools
Online analytical processing tools are very well represented on the Internet in both paid and free versions.
The most popular ones are:
- Dundas BI from Dundas Data Visualization is a browser-based business analyst and data visualization platform that includes integrated dashboards, OLAP reporting and data analytics.
- Yellowfin is a business intelligence platform that is a single, integrated solution designed for companies of all industries and sizes. This system is customizable for businesses in the fields of accounting, advertising, agriculture.
- ClicData is a Business Intelligence (BI) solution designed for use primarily by small and medium-sized businesses. The tool allows end users to create reports and dashboards. Board is designed to integrate business intelligence, corporate performance management and is a full-featured system that serves mid-sized and corporate-level companies.
- Domo is a cloud-based business management suite that integrates with multiple data sources including spreadsheets, databases, social media, and any existing cloud or on-premise software solution.
- InetSoft Style Intelligence is a business analyst software platform that enables users to create dashboards, visual OLAP analysis technology, and mashup reports.
- Birst by Infor Company is a web-based business analyst and analysis solution that brings insights from different teams together to help you make informed decisions. The tool allows decentralized users to scale up the corporate team model.
- Halo is a comprehensive supply chain management and business intelligence system that assists in business planning and inventory forecasting for supply chain management. The system uses data from all sources - large, small and intermediate.
- Chartio is a cloud-based business analyst solution that provides founders, business teams, data analysts, and product teams with the tools to organize their day-to-day work.
- Exago BI is a web-based solution designed to be embedded in web applications. The implementation of Exago BI enables companies of all sizes to provide their clients with ad-hoc, operational and interactive reporting.
Business Impact
The user will find OLAP in most business applications across different industries. The analysis is used not only by the business, but also by other stakeholders.

Some of its most common applications include:
- Marketing OLAP data analysis.
- Financial reporting, which covers sales and expenses, budgeting and financial planning.
- Business process management.
- Sales analysis.
- Database marketing.
The industries continue to grow, which means that users will see more OLAP applications soon. Multivariate tailored processing provides more dynamic analysis. It is for this reason that these OLAP systems and technologies are used to evaluate what-if scenarios and alternative business scenarios.
The OLAP engine is one of the most popular data analysis methods today. There are two main approaches to solving this problem. The first of them is called Multidimensional OLAP (MOLAP) - implementation of the mechanism using a multidimensional database on the server side, and the second Relational OLAP (ROLAP) - building cubes "on the fly" based on SQL queries to a relational DBMS. Each of these approaches has its own pros and cons. Comparative analysis is beyond the scope of this article. We will describe our implementation of the core of the desktop ROLAP module.
This problem arose after the application of the ROLAP system, built on the basis of the Decision Cube components included in Borland Delphi. Unfortunately, the use of this set of components showed poor performance on large amounts of data. This problem can be mitigated by trying to cut off as much data as possible before feeding it into the cubes. But this is not always enough.
On the Internet and in the press, you can find a lot of information about OLAP systems, but almost nowhere is it said about how it works internally. Therefore, the solution to most problems was given to us by trial and error.
Scheme of work
The general scheme of the desktop OLAP system can be represented as follows:
The work algorithm is as follows:
- Getting data in the form of a flat table or the result of executing an SQL query.
- Caching data and converting it to a multidimensional cube.
- Displaying the constructed cube using a crosstab or diagram, etc. In general, an arbitrary number of displays can be connected to one cube.
Let's consider how such a system can be arranged internally. We will start this from the side that can be viewed and touched, that is, from the mappings.
The displays used in OLAP systems are most often of two types - crosstabs and charts. Consider a crosstab, which is the primary and most common way to display a cube.
Cross-table
In the figure below, rows and columns containing aggregated results are shown in yellow, cells containing facts are shown in light gray, and cells containing dimension data are highlighted in dark gray.

Thus, the table can be divided into the following elements, with which we will work in the future:

When filling in the matrix with facts, we should proceed as follows:
- Based on the measurement data, determine the coordinates of the added element in the matrix.
- Determine the coordinates of the columns and rows of totals that are affected by the added item.
- Add an element to the matrix and the corresponding columns and rows of totals.
It should be noted that the resulting matrix will be very sparse, which is why its organization in the form of a two-dimensional array (a variant lying on the surface) is not only irrational, but, most likely, impossible due to the large dimension of this matrix, which cannot be stored. no amount of RAM will be enough. For example, if our cube contains information about sales for one year, and if there are only 3 dimensions in it - Customers (250), Products (500) and Date (365), then we will receive a fact matrix of the following sizes:
Number of elements = 250 x 500 x 365 = 45 625 000
And this despite the fact that the filled elements in the matrix can be only a few thousand. Moreover, the larger the number of measurements, the more sparse the matrix will be.
Therefore, to work with this matrix, you need to use special mechanisms for working with sparse matrices. Various options for organizing a sparse matrix are possible. They are fairly well described in the programming literature, for example, in the first volume of the classic book The Art of Programming by Donald Knuth.
Let us now consider how you can determine the coordinates of a fact, knowing the corresponding measurements. To do this, let's take a closer look at the header structure:
At the same time, you can easily find a way to determine the numbers of the corresponding cell and the totals in which it falls. Several approaches can be proposed here. One is to use a tree to find matching cells. This tree can be built by iterating over the selection. In addition, you can easily define an analytical recurrence formula to calculate the required coordinate.
Data preparation
The data stored in the table must be converted to use it. So, in order to improve performance when building a hypercube, it is desirable to find unique elements stored in columns that are dimensions of the cube. In addition, you can perform preliminary aggregation of facts for records that have the same dimension values. As mentioned above, the unique values available in the measurement fields are important for us. Then the following structure can be proposed for storing them:

By using such a structure, we significantly reduce the memory requirement. Which is quite relevant, since to increase the speed of work, it is desirable to store data in RAM. In addition, only an array of elements can be stored, and their values can be dumped to disk, since we will only need them when displaying a crosstab.
CubeBase Component Library
The ideas described above were the basis for creating the CubeBase component library.

TСubeSource performs caching and transformation of data into an internal format, as well as preliminary data aggregation. Component TСubeEngine calculates the hypercube and operations with it. In fact, it is an OLAP machine that transforms a flat table into a multidimensional dataset. Component TCubeGrid performs the display of the crosstab and controls the display of the hypercube. TСubeChart allows you to see the hypercube in the form of graphs, and the component TСubePivote manages the work of the core of the cube.
Performance comparison
This set of components showed a much higher performance than the Decision Cube. So on a set of 45 thousand records, the Decision Cube components took 8 minutes. to build a pivot table. CubeBase completed loading data in 7 seconds. and building a pivot table in 4 seconds. When testing on 700 thousand Decision Cube records, we did not wait for a response for 30 minutes, after which we removed the problem. CubeBase completed loading data in 45 seconds. and building a cube in 15 seconds.
On data volumes of thousands of records, CubeBase performed tens of times faster than Decision Cube. On tables with hundreds of thousands of records, hundreds of times faster. And high performance is one of the most important indicators of OLAP systems.
In 1993, the founder of the relational approach to building databases, Edgar Codd and partners (Edgar Codd, mathematician and IBM Fellow), published an article initiated by Arbor Software (today it is the famous company "Hyperion Solutions"), entitled "Providing OLAP (operational analytical processing) for user-analysts ", which formulates 12 features of OLAP technology, which were subsequently supplemented by six more. These provisions have become the main content of a new and very promising technology.
The main features of OLAP technology (Basic):
- multidimensional conceptual representation of data;
- intuitive data manipulation;
- availability and detail of data;
- batch data extraction versus interpretation;
- OLAP analysis models;
- client-server architecture (OLAP is accessible from the desktop);
- transparency (transparent access to external data);
- multiplayer support.
Special Features:
- processing of unformalized data;
- saving OLAP results: keeping them separate from the original data;
- elimination of missing values;
- handling of missing values.
Features of presentation of reports (Report):
- flexibility in generating reports;
- standard reporting performance;
- automatic configuration of the physical layer of data extraction.
Dimension management:
- universality of measurements;
- unlimited number of dimensions and aggregation levels;
- unlimited number of operations between dimensions.
Historically, today the term "OLAP" implies not only a multidimensional view of data from the end user, but also a multidimensional representation of data in the target database. This is precisely why the terms "Relational OLAP" (ROLAP) and "Multidimensional OLAP" (MOLAP) appeared as independent terms.
OLAP service is a tool for analyzing large amounts of data in real time. By interacting with the OLAP system, the user will be able to perform flexible viewing of information, obtain arbitrary data slices and perform analytical operations of detailing, convolution, end-to-end distribution, comparison over time in many parameters simultaneously. All work with the OLAP system takes place in terms of the subject area and allows you to build statistically sound models of the business situation.
OLAP software is a tool for online analysis of the data contained in a warehouse. The main feature is that these tools are intended to be used not by a specialist in the field of information technology, not by an expert-statistician, but by a professional in the applied field of management - a manager of a department, department, management, and, finally, a director. The tools are intended for the analyst to communicate with the problem, not with the computer. In fig. 6.14 shows an elementary OLAP cube that allows you to evaluate data in three dimensions.
A multidimensional OLAP cube and a system of corresponding mathematical algorithms for statistical processing allows you to analyze data of any complexity at any time intervals.
Rice. 6.14. Elementary OLAP Cube
Having at his disposal flexible mechanisms for manipulating data and visual display (Fig. 6.15, Fig. 6.16), the manager first looks at the data from different angles, which may or may not be related to the problem being solved.
Then he compares various business indicators with each other, trying to reveal hidden relationships; can look at the data more closely, detailing it, for example, by decomposing it into components by time, by region, or by client, or, conversely, generalize the presentation of information even more to remove distracting details. After that, using the module of statistical estimation and simulation modeling, several scenarios for the development of events are built, and the most acceptable option is selected from them.

Rice. 6.15.
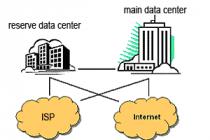
A company manager, for example, may develop a hypothesis that the spread of asset growth in different branches of the company depends on the ratio of specialists with technical and economic education in them. To test this hypothesis, the manager can query from the warehouse and display on the graph the ratio of interest for those branches whose asset growth in the current quarter has decreased by more than 10% compared to the previous year, and for those whose growth has increased by more than 25%. He should be able to use a simple selection from the offered menu. If the results obtained noticeably fall into two corresponding groups, then this should become an incentive for further testing the hypothesis put forward.
Currently, a direction called Dynamic Simulation has developed rapidly, which fully implements the above FASMI principle.
Using dynamic modeling, the analyst builds a model of a business situation evolving over time, according to a certain scenario. At the same time, the result of such modeling can be several new business situations that generate a tree of possible solutions with an assessment of the likelihood and prospects of each.

Rice. 6.16. Analytical IS of data extraction, processing and presentation of information
Table 6.3 shows the comparative characteristics of static and dynamic analysis.
conductingRecently, a lot has been written about OLAP. We can say that there has been some boom around these technologies. True, for us this boom was somewhat late, but this is, of course, connected with the general situation in the country.
Enterprise-scale information systems, as a rule, contain applications designed for complex multivariate analysis of data, their dynamics, trends, etc. This analysis is ultimately intended to facilitate decision-making. Often these systems are called so - decision support systems.
Decision support systems usually have means of providing the user with aggregate data for various samples from the initial set in a form that is convenient for perception and analysis. Typically, such aggregate functions form a multidimensional (and, therefore, non-relational) dataset (often called a hypercube or metacube), the axes of which contain parameters, and the cells - the aggregate data that depend on them - and such data can be stored in relational tables, but in this case, we are talking about the logical organization of data, and not about the physical implementation of their storage). Along each axis, data can be organized in a hierarchy representing different levels of detail. Thanks to this data model, users can formulate complex queries, generate reports, and retrieve subsets of data.
The technology of complex multivariate data analysis is called OLAP (On-Line Analytical Processing).
OLAP is a key component of data warehouse organization.
The OLAP concept was first described in 1993 by Edgar Codd, a renowned database researcher and author of the relational data model.E.F. Codd, S.B. Codd, and C.T. Salley, Providing OLAP (on-line analytical processing) to user-analysts: An IT mandate. Technical report, 1993).
In 1995, based on the requirements set forth by Codd, the so-called Fast Analysis of Shared Multidimensional Information (FASMI) test was formulated, which includes the following requirements for applications for multivariate analysis:
· providing the user with the analysis results in a reasonable time (usually no more than 5 s), even at the cost of a less detailed analysis;
· the ability to carry out any logical and statistical analysis typical for this application and save it in a form accessible to the end user;
· multi-user access to data with support of appropriate locking mechanisms and authorized access means;
· multidimensional conceptual representation of data, including full support for hierarchies and multiple hierarchies (this is a key requirement of OLAP);
· the ability to access any necessary information, regardless of its volume and storage location.
It should be noted that OLAP functionality can be implemented in various ways, from the simplest data analysis tools in office applications to distributed analytical systems based on server products. Users can easily view data in a multidimensional structure as applied to their own needs.
2. What is OLAP
OLAP - an abbreviation for On-Line Analytical Processing - is not a name for a specific product, but for a whole technology. In Russian, it is most convenient to call OLAP online analytical processing. Although some publications refer to analytical processing as both online and interactive, the adjective “operational” as accurately as possible reflects the meaning of OLAP technology.
The development of management solutions by a manager falls into the category of areas of the most difficult to automate. However, today there is an opportunity to assist a manager in developing decisions and, most importantly, to significantly speed up the process of developing decisions, their selection and adoption. You can use OLAP for this.
Let's take a look at how the solution development process usually works.
Historically, solutions for the automation of operational activities are the most developed. We are talking about systems of transactional data processing (OLTP), more simply called operational systems. These systems provide registration of some facts, their short storage and storage in archives. The basis of such systems is provided by relational database management systems (RDBMS). The traditional approach is to try to use already built operating systems to support decision-making. Usually they try to build a developed system of queries to the operational system and use the reports obtained after interpretation directly for decision support. Reports can be built on a custom basis, i.e. the supervisor requests a report, and on a regular basis, when reports are built upon reaching some event or time. For example, a traditional decision support process might look like this: a manager goes to an information department specialist and shares his question with him. The CIO specialist then builds a request to the operational system, receives an electronic report, interprets it, and then communicates it to the management staff. Of course, such a scheme provides to some extent decision support, but it has extremely low efficiency and a huge number of disadvantages. Little data is used to support mission-critical decisions. There are other problems as well. This process is very slow, since the process of writing requests and interpreting an electronic report is time-consuming. It takes many days, at a time when the leader may need to make a decision right now, immediately. If we take into account that the manager, after receiving the report, may be interested in another question (say, clarifying or requiring consideration of the data in a different context), then this slow cycle should be repeated, and since the process of analyzing the data of operational systems will occur iteratively, even more time is spent. Another problem is the problem of different areas of activity of the information technology specialist and the leader, who may think in different categories and, as a result, not understand each other. Then additional refining iterations will be required, and this is again time, which is always not enough. Another important issue is the complexity of the reports to understand. The manager does not have time to choose the figures of interest from the report, especially since there may be too many of them (remember the huge multi-page reports in which several pages are actually used, and the rest - just in case). We also note that the interpretation work most often falls on the specialists of information departments. That is, a competent specialist is distracted by the routine and ineffective work of drawing diagrams, etc., which, naturally, cannot have a favorable effect on his qualifications. In addition, it is not a secret that there are well-wishers in the interpretation chain who are interested in deliberately distorting the incoming information.
The aforementioned shortcomings make one think about both the overall efficiency of the operational system and the costs associated with its existence, since it turns out that the costs of creating an operational system are not adequately compensated for by the efficiency of its work.
In reality, these problems are not a consequence of the poor quality of the operating system or its poor construction. The roots of the problems lie in the fundamental difference between the operational activities that are automated by the operational system and the development and decision-making activities. This difference lies in the fact that the data of operational systems are simply records of some events that have taken place, facts, but in no way information in the general sense of the word. Information is what reduces uncertainty in any area. And it would be very good if information reduced the uncertainty in the field of preparation of decisions. The notorious E.F. Codd, the pioneer of relational database management technologies in the 1970s: “While relational database management systems are available to users, they have never been seen as a powerful tool for synthesizing, analyzing, and consolidating (functions called multivariate data analysis). ) ”. It is precisely about the synthesis of information, about how to turn the data of operational systems into information and even into qualitative assessments. OLAP allows you to do this transformation.
OLAP is based on the idea of a multidimensional data model. Human thinking is multidimensional by definition. When a person asks questions, he imposes restrictions, thereby formulating questions in many dimensions, so the process of analysis in a multidimensional model is very close to the reality of human thinking. According to the dimensions in the multidimensional model, factors influencing the activities of the enterprise (for example: time, products, company departments, geography, etc.) are postponed. Thus, a hypercube is obtained (of course, the name is not very good, since a cube is usually understood as a figure with equal edges, which, in this case, is far from the case), which is then filled with indicators of the enterprise's activity (prices, sales, plan, profits, losses, etc. etc.). This filling can be carried out both with real data of operational systems and predicted on the basis of historical data. The dimensions of the hypercube can be complex, hierarchical, and relationships can be established between them. In the process of analysis, the user can change the point of view on the data (the so-called operation of changing the logical view), thereby viewing the data in different sections and solving specific problems. Various operations can be performed on cubes, including forecasting and conditional planning (what-if analysis). Moreover, the operations are performed at once on the cubes, i.e. a product, for example, will result in a hypercube product, each cell of which is the product of the cells of the corresponding multiplier hypercubes. Naturally, it is possible to perform operations on hypercubes with different numbers of dimensions.
3. OLAP technology creation history
The idea of processing data on multidimensional arrays is not new. It actually dates back to 1962, when Ken Iverson published his book A Programming Language (APL). The first practical implementation of APL took place in the late sixties by IBM. APL is a very elegant, mathematically defined language with multidimensional variables and processable operations. It was meant to be the original powerful multidimensional transformation tool compared to other practical programming languages.
However, the idea did not receive widespread use for a long time, since the time had not yet come for graphical interfaces, high-quality printing devices, and the display of Greek characters required special screens, keyboards and printing devices. Later, English words were sometimes used to replace Greek operators, but the purity campaigners of APL thwarted attempts to popularize their favorite language. APL also consumed machine resources. Its use was expensive in those days. The programs were very slow to execute and, moreover, the very cost of running them. It took a lot of memory, at that time just shocking volumes (about 6 MB).
However, the frustration of these initial mistakes did not kill the idea. It was used in many business applications in the 70s, 80s. Many of these applications have features of modern analytical processing systems. For example, IBM developed an operating system for APL called VSPC, which some people considered the ideal environment for personal use until spreadsheets became ubiquitous.
But APL was too difficult to use, especially since every time there were inconsistencies between the language itself and the hardware on which attempts were made to implement it.
In the 1980s, APL became available on personal machines but did not find market use. The alternative was programming multidimensional applications using arrays in other languages. This was a very difficult task even for professional programmers, which forced the wait for the next generation of multidimensional software products.
In 1972, several applied multidimensional software products previously used for educational purposes found commercial use: Express. It remains in a completely rewritten form even now, but the original concepts of the 70s are no longer relevant. Express is one of the most popular OLAP technologies in the 90s today, and Oracle (r) will push it forward and add new features.
More multidimensional products emerged in the 1980s. At the beginning of the decade - a product called Stratagem, later called Acumate (now owned by Kenan Technologies), which was still promoted until the early 90s, but today, unlike Express, is practically not used.
Comshare System W was a multidimensional product of a different style. Introduced in 1981, it was the first to offer more end-user and financial application development. He brought in many concepts that were not well adapted, such as completely non-procedural rules, full-screen viewing and editing of multidimensional data, automatic recalculation, and batch integration with relational data. However, the Comshare System W was heavy enough for the hardware of the time compared to other products and was used less in the future, sold less, and made no product improvements. Although it is still available on UNIX today, it is not client-server, which does not increase its offer in the analytical market. In the late 1980s, Comshare released a product for DOS and later for Windows. These products were called Commander Prism and used the same concepts as System W.
Another creative product of the late 80s was called Metaphor. It was aimed at professional marketers. He also proposed many new concepts that are only beginning to be widely used today: client-server computing, the use of a multidimensional model on relational data, object-oriented application development. However, the standard personal machine hardware of those days was not able to work with Metaphor and vendors were forced to develop their own standards for personal machines and networks. Gradually Metaphor began to work successfully on serial personal machines, but the product was made exclusively for OS / 2 and had its own graphical user interface.
Metaphor then entered into a marketing alliance with IBM, which was subsequently acquired. In mid-1994, IBM decided to integrate Metaphor technology (renamed DIS) with its future technologies and thereby end funding for a separate direction, but customers expressed their displeasure and demanded continued support for the product. Support continued for the remaining customers, and IBM re-released the product under a new name DIS, which, however, did not make it popular. But Metaphor's creative, innovative concepts have not been forgotten and are visible in many products today.
In the mid-80s, the term EIS (Executive Information System) was born. The first product to clearly demonstrate this direction was the Pilot's Command Center. It was a product that allowed collaborative computing, what we call client-server computing today. Because the power of personal computers in the 1980s was limited, the product was very “server-centric,” but the principle is still very popular today. Pilot did not sell the Command Center for long, but offered many concepts that can be learned in today's OLAP products, including automatic timing, multidimensional client / server computing, and simplified control of the analysis process (mouse, sensitive screens, etc.). Some of these concepts were reapplied later in the Pilot Analysis Server.
In the late 1980s, spreadsheets were the dominant tool in the market for providing analysis to end users. The first multidimensional spreadsheet was introduced by Compete. It was marketed as a very expensive product for specialists, but the vendors did not provide a market capture opportunity for this product, and Computer Associates acquired the rights to it along with other products, including Supercalc and 20/20. The main effect of the acquisition of CA Compete was a sharp price reduction and removal of copy protection, which naturally contributed to its spread. However, it was not successful. Compete is at the heart of Supercalc 5, but its multidimensional aspect is not being promoted. The old Compete is still sometimes used due to the fact that a lot of money was invested in it at one time.
Lotus was next to try to enter the multidimensional spreadsheet market with Improv, which runs on a NeXT machine. This ensured, at a minimum, that sales of 1-2-3 did not decline, but when it was eventually released for Windows, Excel already had a large market share, which prevented Lotus from making any changes to the distribution of the market. Lotus, like CA with Compete, moved Improv to the lower end of the market, but this was not a prerequisite for successful market advancement, and new developments in this area did not continue. It turned out that personal computer users preferred 1-2-3 spreadsheets and were not interested in new multidimensional capabilities if they were not fully compatible with their old spreadsheets. Likewise, the concepts of small, desktop spreadsheets offered as personal applications have not really proven to be convenient and have not taken root in the real business world. Microsoft (r) has taken this path, adding PivotTables (in the Russian edition it is called “pivot tables”) to Excel. While few Excel users have benefited from this feature, it is probably the only fact that the multidimensional analysis capabilities are widely used in the world, simply because there are so many Excel users in the world.
4. OLAP, ROLAP, MOLAP ...
It is well known that when Codd published his rules for building relational DBMSs in 1985, they caused a strong reaction and subsequently had a strong impact on the DBMS industry in general. However, few people know that in 1993 Codd published a work titled "OLAP for User Analysts: What It Should Be". In it, he outlined the basic concepts of online analytical processing and identified 12 rules that must be met by products that enable online analytical processing.
These are the rules (original text kept where possible):
1. Conceptual multidimensional representation. The analyst user sees the enterprise world as multidimensional in nature. Accordingly, the OLAP model should be multidimensional at its core. A multidimensional conceptual schema or custom view facilitates modeling and analysis as well as computation.
2. Transparency. Regardless of whether the OLAP product is part of the user's funds or not, this fact should be transparent to the user. If OLAP is provided by client-server computing, then this fact should also, if possible, be invisible to the user. OLAP should be presented in the context of a truly open architecture, allowing the user, wherever they are, to communicate with the server using an analytic tool. In addition, transparency must be achieved when the analytical tool interacts with homogeneous and heterogeneous database environments.
3. Availability. An OLAP analyst user should be able to perform analysis based on a common conceptual schema containing enterprise-wide data in a relational database, as well as data from legacy legacy databases, shared access methods, and a common analytic model. This means that OLAP must provide its own logic for access in a heterogeneous database environment and perform appropriate transformations to present the data to the user. Moreover, it is necessary to think in advance about where and how, and what types of physical data organization will actually be used. The OLAP system should only access the data that is actually needed, and not apply the general “kitchen funnel” principle that entails unnecessary input.
4. Consistent productivity when developing reports. If the number of dimensions or the size of the database increases, the analyst user should not feel any significant degradation in performance. Consistent performance is critical to supporting the end user with ease of use and limiting the complexity of OLAP. If the user analyst experiences significant differences in performance according to the number of dimensions, then he will seek to compensate for these differences with design strategy, which will cause the data to be presented in other ways, but not in the way that the data really needs to be presented. Taking the time to walk around the system to compensate for its inadequacy is not what analytics products are designed to do.
5. Client-server architecture. Most of the data that needs to be processed online today is contained on mainframes and accessed via a PC. This means, therefore, that OLAP products must be able to work in a client-server environment. From this point of view, it is necessary that the server component of the analytic tool is substantially “intelligent” so that different clients can connect to the server with minimal hassle and integration programming. An “intelligent” server must be able to perform mapping and consolidation between inappropriate logical and physical database schemas. This will provide transparency and build an overall conceptual, logical and physical schema.
6. General multidimensionality. Each dimension should be applied without regard to its structure and operational capabilities. Additional operational capabilities can be provided to selected dimensions, and since the dimensions are symmetrical, a single function can be provided to any dimension. Basic data structures, formulas and report formats should not be biased towards any dimension.
7. Dynamic management of sparse matrices. The physical design of an OLAP tool must be fully adapted to the specific analytical model for optimal management of sparse matrices. For any given sparse matrix, there is one and only one optimal physical scheme. This scheme provides the maximum memory efficiency and matrix operability, if, of course, the entire data set does not fit in memory. The underlying physics of an OLAP tool must be configured to any subset of dimensions, in any order, for practical operations with large analytical models. Physical accessors must also dynamically change and contain different types of mechanisms, such as: direct computation, B-trees and derivatives, hashing, the ability to combine these mechanisms if necessary. Sparseness (measured as the percentage of empty cells to all possible) is one of the characteristics of data dissemination. The inability to regulate sparsity can make the efficiency of operations unattainable. If the OLAP tool cannot control and regulate the distribution of the values of the analyzed data, a model that claims to be practical, based on many consolidation paths and dimensions, in reality, may be unnecessary and hopeless.
8. Multi-user support. Often, multiple analytic users need to work together with the same analytic model or create different models from the same data. Therefore, the OLAP tool must provide sharing (query and complement), integrity, and security capabilities.
9. Unlimited crossovers. The various rollup levels and consolidation paths, due to their hierarchical nature, represent dependent relationships in an OLAP model or application. Therefore, the tool itself should imply the appropriate calculations and not require the analyst user to redefine those calculations and operations. Computations that do not follow from these inherited relationships require different formulas to be defined according to some applicable language. Such a language can allow computation and manipulation of data of any dimension and not restrict the relationship between data cells, not pay attention to the number of common data attributes of specific cells.
10. Intuitive data manipulation. The reorientation of consolidation paths, detailing, enlargement and other manipulations regulated by the consolidation paths should be applied through a separate impact on the cells of the analytical model, and should not require the use of a menu system or other multiple actions with the user interface. The analyst user perspective on the dimensions defined in the analytic model should contain all the information necessary to perform the above actions.
11. Flexible reporting options. Analyzing and presenting data is simple when the rows, columns and cells of data that will be visually compared with each other will be close to each other or according to some logical function that takes place in the enterprise. Reporting tools should present synthesized data or information resulting from the data model in any possible orientation. This means that rows, columns, or pages must show from 0 to N dimensions at a time, where N is the number of dimensions in the entire analytical model. In addition, each content dimension shown in a single record, column, or page must also be capable of showing any subset of the elements (values) contained in the dimension, in any order.
12. Unlimited dimension and number of aggregation levels. Investigation into the possible number of required measurements required in an analytical model has shown that up to 19 measurements can be used simultaneously. Hence the strong recommendation that the analytic tool be able to provide at least 15 dimensions simultaneously and preferably 20. Moreover, each of the generic dimensions should not be limited by the number of user-analytic user-defined aggregation levels and consolidation paths.
In fact, OLAP product developers today follow these rules, or at least strive to follow them. These rules can be considered the theoretical basis of operational analytical processing, it is difficult to argue with them. Subsequently, many consequences were derived from the 12 rules, which, however, we will not cite, so as not to unnecessarily complicate the story.
Let's take a closer look at how OLAP products differ in their physical implementation.
As noted above, OLAP is based on the idea of processing data on multidimensional structures. When we say OLAP, we mean that the data structure of an analytical product is logically multidimensional. How exactly this is implemented is another matter. There are two main types of analytical processing, which include certain products.
MOLAP ... Multidimensional OLAP itself. The product is based on a non-relational data structure that provides multidimensional storage, processing and presentation of data. Accordingly, databases are called multidimensional. Products belonging to this class usually have a multidimensional database server. Data in the analysis process is selected exclusively from a multidimensional structure. This structure is highly efficient.
ROLAP ... Relational OLAP. As the name implies, the multidimensional structure in such tools is implemented by relational tables. And the data in the analysis process, respectively, is selected from the relational database by the analytical tool.
The disadvantages and advantages of each approach are, in general, obvious. Multidimensional OLAP provides better performance, but structures cannot be used to process large amounts of data, since large dimensions will require large hardware resources, and at the same time, the sparseness of hypercubes can be very high and, therefore, the use of hardware capacity will not be justified. On the contrary, relational OLAP provides processing on large arrays of stored data, since it is possible to provide more economical storage, but, at the same time, it loses significantly in the speed of multidimensional work. Such reasoning led to the identification of a new class of analytical tools - HOLAP. This is hybrid online analytical processing. Tools of this class allow you to combine both approaches - relational and multidimensional. Access can be conducted to both multidimensional database data and relational data.
There is another rather exotic type of on-line analytical processing - DOLAP. This is desktop OLAP. We are talking about such analytical processing, where hypercubes are small, their dimension is small, needs are modest, and for such analytical processing a personal machine on the desktop is enough.
Operational analytical processing allows you to significantly simplify and speed up the process of preparation and decision-making by management personnel. Online analytical processing serves the purpose of turning data into information. It is fundamentally different from the traditional decision support process, which is most often based on the consideration of structured reports. By analogy, the difference between structured reports and OLAP is the same as between driving around the city by tram and by car. When you ride a tram, it moves along the rails, which does not allow you to see well distant buildings, and even more so to get closer to them. On the contrary, driving a private car gives you complete freedom of movement (of course, traffic rules should be observed). You can drive up to any building and get to places where trams do not run.
Structured reports are the rails that hold back the freedom to prepare decisions. OLAP is a vehicle for efficient traffic on information highways.