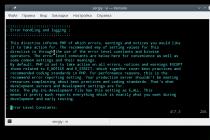
The topic of this article is the use of a Windows tool unfamiliar to most users: Event Viewer or Event Viewer.
What could it be useful for? First of all, if you want to figure out what is happening with the computer yourself and solve various kinds of problems in the operation of the OS and programs, this utility can help you, provided that you know how to use it.

The interface of this administration tool can be divided into three parts:
- In the left panel there is a tree structure in which events are sorted by various parameters. In addition, you can also add your own "Custom Views" here, in which only the events you need will be displayed.
- In the center, when you select one of the "folders" on the left, the list of events will be displayed, and when you select any of them, at the bottom you will see more detailed information about it.
- The right side contains links to actions that allow you to filter events by parameters, find the ones you need, create custom views, save the list, and create a task in the Task Scheduler that will be associated with a specific event.
Event Information

As I said above, when you select an event, information about it will be displayed at the bottom. This information can help you find a solution to the problem on the Internet (however, not always) and it is worth understanding which property means what:
- Log name - the name of the log file where the event information was saved.
- Source - the name of the program, process or system component that generated the event (if you see Application Error here), then you can see the name of the application itself in the field above.
- The code- event code, can help you find information about it on the Internet. True, it is worth looking in the English-language segment for the request Event ID + digital designation of the code + name of the application that caused the failure (since the event codes for each program are unique).
- Operation code - as a rule, "Details" is always indicated here, so this field is of little use.
- Task category, keywords - usually not used.
- User and computer - reports on behalf of which user and on which computer the process that caused the event was launched.
At the bottom, in the "Details" field, you can also see the "Online Help" link, which sends information about the event to the Microsoft website and, in theory, should display information about this event. However, in most cases you will see a message that the page was not found.
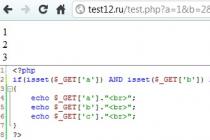
To find information by mistake, it is better to use the following query: Application Name + Event ID + Code + Source. An example can be seen in the screenshot. You can also try searching in Russian, but there are more informative results in English. Text information about the error is also suitable for searching (double-click on the event).

Note: on some sites you can find an offer to download programs for fixing errors with one or another code, and all possible error codes are collected on one site - you should not download such files, they will not fix problems, and most likely will entail additional ones.
It is also worth noting that most warnings are not dangerous, and error messages also do not always indicate that something is wrong with the computer.
Viewing the Windows Performance Log
You can find quite a few interesting things in the Windows Event Viewer, for example, look at problems with the performance of the computer.

To do this, in the right pane, open Applications and Services Logs - Microsoft - Windows - Diagnostics-Perfomance - Running and see if there are any errors among the events - they report that some component or program has slowed down Windows boot. By double clicking on an event, you can call up detailed information about it.
Using Filters and Custom Views
A huge number of events in the logs leads to the fact that it is difficult to navigate in them. In addition, most of them do not carry critical information. The best way to display only the events you want is to use custom views: you can set the level of events you want to display - errors, warnings, critical errors, and their source or log.

To create a custom view, click the corresponding item in the panel on the right. After creating a custom view, you can apply additional filters to it by clicking on "Filter current custom view".
Of course, this is not all that Windows Event Viewer can come in handy for, but this, as noted, is an article for novice users, that is, for those who do not know about this utility at all. Perhaps it will encourage further study of this and other OS administration tools.
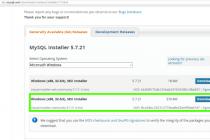
The classic case of Event Viewer was implemented as an ActiveX object in c:\windows\system32\els.dll. If you register it then you get a snap event viewer for Microsoft Management Console (MMC). Follow the instructions below to find out how.
- Open a command prompt window (press the Win+X key on your keyboard and select "Command Prompt (Admin).
- Enter the following command regsvr32 els.dll
You will get the message "DllRegisterServer in els.dll succeeded". Click the "OK" button to close it.
- Return to the command window and type mmc, and then press the Enter button. The Microsoft Management Console application will open. Select a menu item File - Add/Remove Snap or press keyboard shortcut Ctrl+M on keyboard.
In the list on the left, select and click on the "Add" button. In the "Select Computer" dialog box, just click the "Finish" button.
In the "Add or Remove Snap-ins" dialog box, click the "OK" button. Run the menu item "File - Options ...". Here you can change the name and icon of the console before you save it to a file. I recommend that you change the console mode to "user mode - full control" and check the box on the option "do not save changes for this console", otherwise confirm " Save Changes" will annoy you every time you use it.
 Click the "OK" button to close this window. From the menu item select "File" - "Save" and give it any filename (ex. CEventVwr.msc) and save it to a location such as C:\Windows or C: \windows\system32. You can save it anywhere on your desktop, but saving the file in the above directory will allow you to quickly use it by entering the name in the Run dialog box and you don't even have to enter the full path to it every time you use it. Or you can use the file that was created specifically for this function in Windows 8.
The Windows 7 operating system constantly monitors various noteworthy events that occur in your system. On Microsoft Windows event is any incident in the operating system that is logged or that requires notification to users or administrators. This could be a service that doesn't want to start, a device installation, or an application error. Events are logged and stored in the Windows event logs and provide important historical information to help you monitor your system, maintain system security, troubleshoot problems, and perform diagnostics. The information contained in these logs should be reviewed regularly. You should regularly monitor the event logs and configure the operating system to save important system events. In the event that you are an administrator of Windows servers, then you need to monitor the security of their systems, the normal operation of applications and services, and also check the server for errors that can degrade performance. If you are a PC user, then you should make sure that you have access to the appropriate logs needed to maintain your system and troubleshoot errors.
Program Event Viewer is a Microsoft Management Console (MMC) snap-in for viewing and managing event logs. It is an indispensable tool for monitoring system health and troubleshooting. The Windows service that manages event logging is called "The event log". In the event that it is running, Windows writes important data to the logs. With the help of the program Event Viewer you can do the following:
- View events of specific logs;
- Apply event filters and save them for later use as custom views;
- Create event subscriptions and manage them;
- Assign the execution of specific actions to the occurrence of a specific event.
Launching the Event Viewer
Application Event Viewer can be opened in the following ways:
Event Logs in Windows 7
In the Windows 7 operating system, as well as in Windows Vista, there are two categories of event logs: Windows logs and application and service logs. Windows logs- are used by the operating system to register system-wide events related to the operation of applications, system components, security and startup. BUT application and service logs- are used by applications and services to register events related to their operation. You can use the snap-in to manage event logs Event Viewer or command line program wevtutil which will be discussed in the second part of the article. All log types are described below:

Application- stores important events related to a specific application. For example, Exchange Server stores events related to mail forwarding, including information store events, mailbox events, and running services. The default location is %SystemRoot%\System32\Winevt\Logs\Application.Evtx.
Safety- Stores security-related events such as login/logout, privilege usage, and resource access. By default placed in %SystemRoot%\System32\Winevt\Logs\Security.Evtx
Installation- this log records events that occur during the installation and configuration of the operating system and its components. The default location is %SystemRoot%\System32\Winevt\Logs\Setup.Evtx.
System- stores events of the operating system or its components, such as failures to start services or initialize drivers, system-wide messages, and other messages related to the system as a whole. By default placed in %SystemRoot%\System32\Winevt\Logs\System.Evtx
Forwarded events- if event forwarding is configured, this log includes events forwarded from other servers. By default placed in %SystemRoot%\System32\Winevt\Logs\ForwardedEvents.Evtx
Internet Explorer- this log records events that occur when configuring and working with the Internet Explorer browser. By default placed in %SystemRoot%\System32\Winevt\Logs\InternetExplorer.Evtx
Windows PowerShell- Events related to the use of the PowerShell shell are logged in this log. By default located in %SystemRoot%\System32\Winevt\Logs\WindowsPowerShwll.Evtx
Equipment events- if equipment event logging is configured, events generated by devices are written to this log. By default placed in %SystemRoot%\System32\Winevt\Logs\HardwareEvent.Evtx
In Windows 7, the event logging infrastructure is XML-based, as in Windows Vista. The data for each event follows an XML schema, allowing you to access the XML code for any event. In addition, you can create XML-based queries to retrieve data from logs. No knowledge of XML is required to use these new features. rigging Event Viewer provides a simple graphical interface for accessing these features.
Event Properties
There are several snap-in event properties Event Viewer which are detailed below:
Source is the program that logged the event. This can be either the name of a program (for example, "Exchange Server") or the name of a system component or a large application (for example, the name of a driver). For example, "Elnkii" means the EtherLink II driver.
Event code is a number that specifies a particular type of event. The first line of the description usually contains the name of the event type. For example, 6005 is the event ID that occurs when the event logging service starts. Accordingly, at the beginning of the description of this event is the line "Event log service started". The event ID and record source name can be used by the software product support team for troubleshooting purposes.
Level is the level of importance of the event. In the system and application logs, events can have the following severity levels:
- Notification- denotes a change in an application or component, such as the occurrence of an information event associated with a successful action, the creation of a resource, or the start of a service.
- Warning- indicates a general warning about a problem that could affect the service or lead to a more serious problem if left unattended;
- Error- indicates that a problem has occurred that may affect functions external to the application or component that raised the event;
- Critical error- indicates that a failure has occurred from which the application or component that fired the event cannot recover automatically;
- Success audit- Successful completion of activities that you track through auditing, such as the use of a privilege;
- Failure audit- failure of actions that you track through auditing, such as a login failure.
User- defines the user account on whose behalf this event occurred. Users include specific entities such as Local Service, Network Service, and Anonymous Logon, as well as real user accounts. This name is the client ID if the event was actually raised by the server process, or the main ID if no impersonation is in progress. In some cases, a security log entry contains both identifiers. And also in this field there can be N / A (N / A) if the account is not applicable in this situation. Impersonation occurs when the server allows one process to assign the security attributes of another process.
Working code- contains a numeric value that specifies the operation or point within the operation that triggered the event. For example, initialization or closing.
Magazine- the name of the log in which this event was recorded.
Category and tasks- defines the category of the event, sometimes used to further describe a valid action. Each event source has its own categories. For example, the following categories are: Login/Logout, Privilege Use, Policy Change, and Account Management.
Keywords is a set of categories or labels that can be used to filter or search for events. For example: "Network", "Security" or "Resource not found".
A computer- identifies the name of the computer on which the event occurred. This is usually the name of the local computer, but can also be the name of the computer that forwarded the event, or the name of the local computer before it was changed.
date and time- defines the date and time of occurrence of this event in the log.
Process ID- represents the identification number of the process that generated this event. A computer program is only a passive set of instructions, while a process is the direct execution of these instructions.
Thread ID- represents the identification number of the thread that created this event. A process spawned in an operating system can consist of several threads running "in parallel", that is, without a prescribed order in time. For some tasks, this separation can achieve more efficient use of computer resources.
Processor ID- represents the identification number of the processor that processed the event.
Session code is the identification number of the session on the terminal server in which the event occurred.
Kernel Time Specifies the time spent executing kernel-mode instructions, in units of CPU time. Kernel mode has unlimited access to system memory and external devices. The kernel of an NT system is called a hybrid kernel or a macrokernel.
Operating time in user mode Specifies the time spent executing user-mode instructions, in units of CPU time. User mode consists of subsystems that pass I/O requests to the appropriate kernel mode driver via the I/O manager.
Processor load is the time spent executing user-mode instructions, in CPU ticks.
Correlation code- defines the action in the process for which the event is used. This code is used to specify simple relationships between events. Correlation is a statistical relationship between two or more random variables (or variables that can be considered as such with some acceptable degree of accuracy). At the same time, changes in one or more of these quantities lead to a systematic change in the other or other quantities.
Relative Correlation ID- defines the relative action in the process for which the event is used
Working with event logs
Event Viewer
You can see the log in the following screenshot. "Applications", which provides information about events, recent views, and available actions. To view Application log events, follow these steps:
- In the console tree, select "Windows Logs";
- Choose a magazine "Applications".
It is advisable to review the event logs more often "Application" and "System" and study existing problems and warnings that may portend problems in the future. When a log is selected, the middle window displays the available events, including the date of the event, time and source, event level, and more.
Panel "view area" shows basic event data on the tab "General", and additional specific data on the tab "Details". You can turn this panel on and off by selecting the menu "View" and then the command "view area".
For critical systems, it is recommended to keep logs for the last few months. As a rule, assigning logs such a size that all the information fits in them is inconvenient, as a rule, this problem can be solved in another way. You can export logs to files located in a specified folder. To save the selected log, do the following:
- In the console tree, select the event log you want to save;
- Choose a team "Save events as" from the menu "Action" or from the context menu of the log, select the command "Save all events as";
- In the dialog that appears "Save as" select the folder where the file should be saved. If you want to save the file in a new folder, you can create it directly from this dialog using the context menu or the button "New folder" on the action bar. In field "File type" you need to select the desired file format from the available ones: event files - *.evtx, xml file - *.xml, tab-separated text - *.txt, comma-separated csv - *.csv. In field "File name" "Save". To cancel saving, press the button "Cancel";
- In the event that the event log is not intended to be viewed on another computer, in the dialog box "Display Details" leave the default option "Do not display details", and if the log is intended to be viewed on another computer, then in the dialog box "Display Details" choose an option "Display information for the following languages" and click on the button "OK".

Clearing the event log
Sometimes it is necessary to clear the full event logs to ensure effective analysis of operating system warnings and critical errors. To clear the selected log, do the following:

- In the console tree, select the event log you want to clear;
- Clear the log in one of the following ways:
- On the menu "Action" select a team "Clear Log";
- On the selected log, right-click to open the context menu. In the context menu, select the command "Clear Log";
- Next, you can either clear the log or archive it if this has not been done before:
- To clear the event log without saving, click the button "Clear";
- To clear the event log after saving it, click the button "Save and Clean". In the dialog that appears "Save as" select the folder where the file should be saved. If you want to save the file in a new folder, you can create it directly from this dialog using the context menu or the button "New folder" on the action bar. In field "File name" enter a name and click on the button "Save". To cancel saving, press the button "Cancel".
Setting the maximum log size
As mentioned above, event logs are stored as files in the %SystemRoot%\System32\Winevt\Logs\ folder. By default, the maximum size of these files is limited, but you can change it in the following way:

- Choose a team "Properties" from the menu "Action"
- In field "Max Log Size (KB)" set the required value using the counter or set manually without using the counter. In this case, the value will be rounded up to the nearest multiple of 64 KB because the size of the log file must be a multiple of 64 KB and cannot be less than 1024 KB.
Events are stored in a log file, which can only grow up to a specified maximum size. After the file reaches the maximum size, the processing of incoming events will be determined by the log retention policy. The following log retention policies are available:
Rewrite events if necessary (old files first)- in this case, new entries continue to be logged after it is full. Each new event replaces the oldest one in the log;
Archive log when full; do not rewrite events- in this case, the log file is automatically archived if necessary. Stale events are not overwritten.
Do not rewrite events (clear log manually)- in this case, the log is cleared manually, not automatically.
To select the desired log retention policy, follow these steps:
- In the console tree, select the event log for which you want to resize;
- Choose a team "Properties" from the menu "Action" or from the context menu of the selected journal;
- On the tab "General", In chapter "Upon reaching the maximum size" select the required parameter and press the button "OK".

Enable analytic and debug logging
Analytic and debug logs are disabled by default. Once activated, they quickly fill up with a large number of events. For this reason, it is desirable to enable these logs for a limited period of time in order to collect the data necessary for troubleshooting, and then disable them again. Logs can be activated as follows:
- In the console tree, find and select the analytic or debug log you want to activate;
- Choose a team "Properties" from the menu "Action" or from the context menu of the selected analytic or debug log;
- On the tab "General" check the box on the options "Enable logging"
Opening and closing a saved log
With the help of equipment Event Viewer you can open and view previously saved logs. You can open multiple saved logs at the same time and access them at any time in the console tree. Magazine opened in Event Viewer, can be closed without deleting the information it contains. To open a saved log, do the following:


- Choose a team "Open saved log" on the menu "Action" or from the context menu in the console tree;
- 3. In the dialog box "Open saved log", moving through the directory tree, open the folder containing the desired file. By default, all event log files will be displayed in the dialog box. Also, when opening, you can select the type of files that you want to display in the open dialog. Available file types are: event log files (*.evtx, *.evt, *.etl), as well as event files (*.evtx), legacy event files (*.evt), or trace log files (*.etl). After the desired log file is found, select it by clicking on it with the left mouse button, which will place its name in the line for entering the file name and click on the button "Open".
- In dialogue "Open saved log", in field "Name" enter a new name to be used for the log in the console tree. It is only used to represent the log in the console tree and does not change the log file name. You can also use an existing log file name. In field "Description" enter a description for the log. It will be displayed in the center pane when the parent log folder is highlighted in the console tree;
- To create a folder in which the saved log will be located, click the button "Create a folder". In field "Name" enter the name of the folder where the open log will be located, and then click the button "OK". If no parent folder is selected, the new folder will be located in the folder "Saved Logs".
- To make the open event log inaccessible to other computer users, you can clear the checkbox "All users". If this checkbox remains active, the open log will be available to all users, but administrator rights will be required to remove it from the console tree;
- To open the magazine, click on the button "OK".
To remove an open log from the event tree, do the following:

- In the console tree, select the log you want to delete;
- Choose a team "Delete" from the menu "Action" or from the context menu of the selected journal;
- In dialogue Event Viewer click on the button "Yes".
Conclusion
This part of the article on the Event Viewer snap-in describes the snap-in itself and describes in detail the basic operations related to monitoring and maintaining the system using the Event Viewer. The next part of the article will be designed for experienced Windows users. It will cover tasks with custom views, filtering, grouping/sorting events, and managing subscriptions.
The Windows OS line registers all the main events that occur in the system, followed by their entry in the log. Errors, warnings and just various notifications are recorded. Based on these records, an experienced user can correct the operation of the system and eliminate errors. Let's learn how to open the event log in Windows 7.
The event log is stored in a system tool called Event Viewer. Let's see how you can get into it using various methods.
Method 1: "Control Panel"
One of the most common ways to run the tool described in this article, although far from the easiest and most convenient, is by using "Control Panels".


Method 2: Run Tool
It is much easier to initiate the activation of the described tool using the tool "Run".


The basic disadvantage of this quick and convenient method is the need to keep in mind the window command.
Method 3: Start Menu Search Box
A very similar method of calling the tool we are studying is carried out using the menu search field "Start".

Method 4: "Command line"
Calling the tool via "Command line" rather inconvenient, but such a method exists, and therefore it is also worth a separate mention. First we need to call the window "Command line".

Method 5: Direct start of the eventvwr.exe file
You can use such an "exotic" option for solving the problem as a direct start of the file from "Explorer". Nevertheless, this method can also be useful in practice, for example, if the failures have reached such a scale that other options to launch the tool are simply not available. This is extremely rare, but quite possible.
First of all, you need to navigate to the location of the eventvwr.exe file. It is located in the system directory at the following path:
C:\Windows\System32

Method 6: Entering the file path in the address bar
With help "Explorer" we can launch the window we are interested in and faster. In this case, you do not even have to look for eventvwr.exe in the directory "System32". To do this, in the address field "Explorer" you just need to specify the path to this file.

Method 7: Create a shortcut
If you don't want to remember different commands or navigate through sections "Control Panels" consider too inconvenient, but at the same time you often use the magazine, then in this case you can create an icon on "Desktop" or in another place convenient for you. Then run the tool Event Viewer will be carried out as simply as possible and without the need to remember something.

Problems opening the magazine
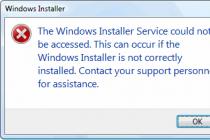
There are cases when there are problems with opening the magazine in the ways described above. Most often this happens due to the fact that the service responsible for the operation of this tool is deactivated. When trying to run the tool Event Viewer a message will be displayed stating that the event log service is unavailable. Then you need to activate it.

- First of all, you need to go to "Service Manager". This can be done from the section "Control Panels", which is called "Administration". How to go to it was described in detail when considering Method 1. Once in this section, look for the item "Services". Click on it.

AT "Service Manager" you can go with the tool "Run". Call it by typing Win+R. Type in the input area:
Click OK.
- Regardless of whether you made the transition through "Control Panel" or used the command input in the tool field "Run", starts "Service Manager". Look for an element in the list "Windows Event Log". To facilitate the search, you can arrange all the objects in the list in alphabetical order by clicking on the field name "Name". After the desired row is found, take a look at the corresponding value in the column "State". If the service is enabled, then there should be an inscription "Works". If it is empty, it means that the service is deactivated. Also look at the value in the column "Startup Type". In normal condition, there should be an inscription "Automatically". If there is a value "Disabled", it means that the service is not activated at system startup.
- To fix this, go to the properties of the service by double-clicking on the name paintwork.
- A window opens. Click on an area "Startup Type".
- Choose from the dropdown list "Automatically".
- Click on the captions "Apply" and OK.
- Returning to "Service Manager", check "Windows Event Log". In the left area of the shell, click on the inscription "Run".
- The service has been started. Now in the column field corresponding to it "State" value will be displayed "Works", and in the column field "Startup Type" an inscription will appear "Automatically". Now the magazine can be opened in any of the ways that we described above.


There are quite a few options to activate the event log in Windows 7. Of course, the most convenient and popular ways are to go through "Toolbar", activation using the tool "Run" or menu search fields "Start". For easy access to the described function, you can create an icon on "Desktop". Sometimes there are problems starting the window Event Viewer. Then you need to check if the corresponding service is activated.
Windows is a fairly complex operating system and tracking all processes, including errors, is difficult for an inexperienced user.
For these purposes, in the OS itself recording is provided everything that happens and all actions in the system. You can display and view this log using the Windows Event Viewer.
Windows Event Viewer display
There are two ways to view information about the operation of the OS:
- With cmd ( command line);
- By using control panels.
To call the cmd line, you can use keyboard shortcut Win+R or go through the well-known chain: Start - All Programs - Accessories - Command line.
In the window that opens, enter the sequence eventvwr.msc
Or, through Start - Control Panel - System and Maintenance - Administration.
The main utility window will be displayed on the desktop. Select the item "". 
Do not be afraid if errors are found in the list. Even in a perfectly working system, such messages may appear. In most cases, they are single and caused by minor glitches in the application.
Most likely, for an ordinary user, descriptions of errors will not say anything. Viewing the logs can help the system administrator or "advanced" user to understand the resulting system failures.
How to use view
What information can be learned from a magazine? If your computer systematically issues errors, randomly reboots, or crashes the “blue screen of death”, then all events that led to the failure are logged by the system. When viewing information you can find out at what time which service, driver, or hardware component caused a particular error. Based on this information, you can take the necessary measures to eliminate violations.
The log can be used for other purposes besides error information. You can bind to any event in the system performing a specific task. This will allow in the future, in the event of a similar situation, to automatically fulfill the set condition.
To do this, it is enough on any element from the list call context menu right click and select " Link a task». 
Clearing the event log
Removing all information from the log is also not difficult. To do this, in the left block of the log window, select the element of the menu tree that needs to be cleared, right-click to call the context menu - " Clear log»